Scan your app for slow requests and database bottlenecks with Performance Agent, then fix the issues with Agent and republish.
Performance Agent reviews your project’s source code and logs to find concrete, fixable problems that make your app slow. Each finding comes with a plain-language summary, a severity, and a recommended fix that Agent can apply for you.
Performance Agent looks for two types of issues. Each type appears as its own group in the results.
Latency: parts of your app that make visitors wait. For example, a page might do slow work one step at a time instead of all at once, or repeat the same work on every visit.
Data layer: database problems such as N+1 queries, missing indexes, and loading more data than the page needs.
Performance Agent only reports and fixes issues it can tie to your code. It
doesn’t change your machine size or other deployment settings. To give your app
more power, see Machine configuration.
A paid plan. Performance Agent is available to builders on a paid plan. If you’re on the free plan, the Performance scan card shows an upgrade option.
Edit access to the project.
You can scan an app before you publish it. After you publish, Performance Agent can also use your deployment logs to find endpoints that are slow for real visitors.The scan only reads your project. It doesn’t change your code, your database, or your published app. Changes only happen when you choose to fix issues.
In your project’s Tools pane, open Monitoring under Replit Cloud. Scroll to the Performance scan card.
2
Run a scan
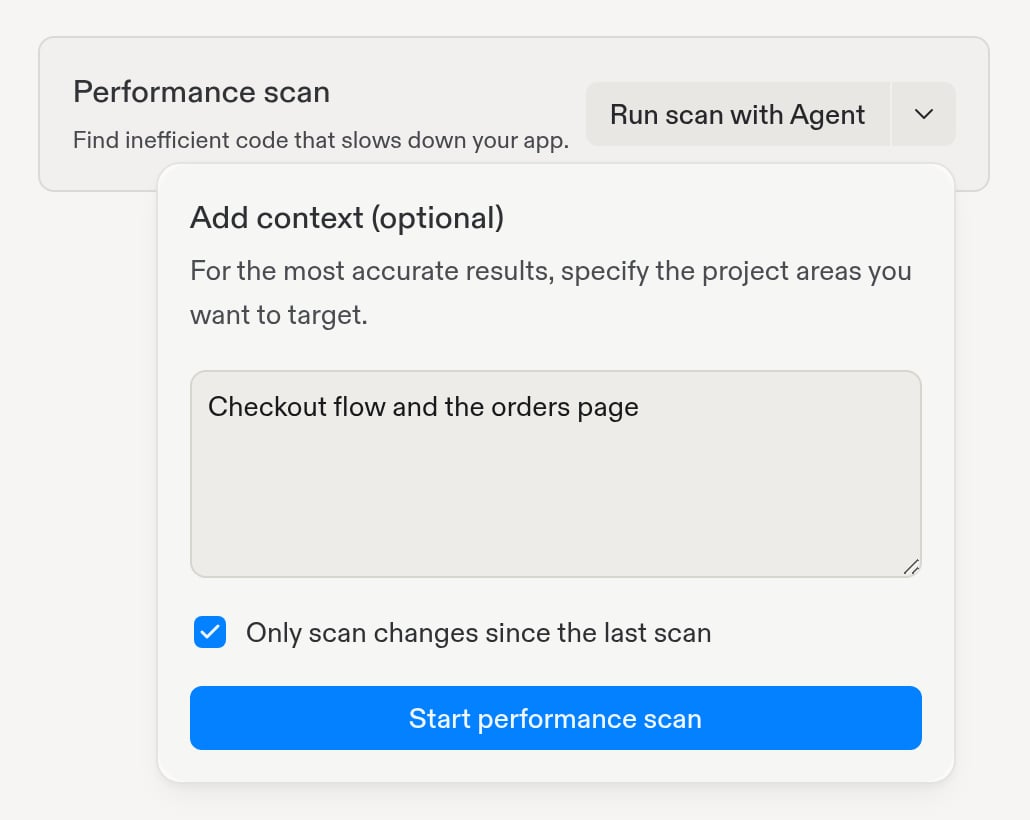
Select Run scan with Agent to scan your whole project with the default settings.To focus the scan, select the arrow next to Run scan with Agent first:
Add context (optional): describe the parts of your app you care about, such as “checkout flow and the orders page”.
Only scan changes since the last scan: check this box to review only what changed since your previous scan. Performance Agent also rechecks the issues from that scan to see whether they are still present.
Then select Start performance scan.
Add context or limit the scan to recent changes before starting it
3
Wait for the results
The scan runs as a separate task, so you can keep building. While it runs, the card shows Scan in progress. A scan usually takes a few minutes. Select Go to task to follow along.
You can also ask Agent to start a scan from the chat:
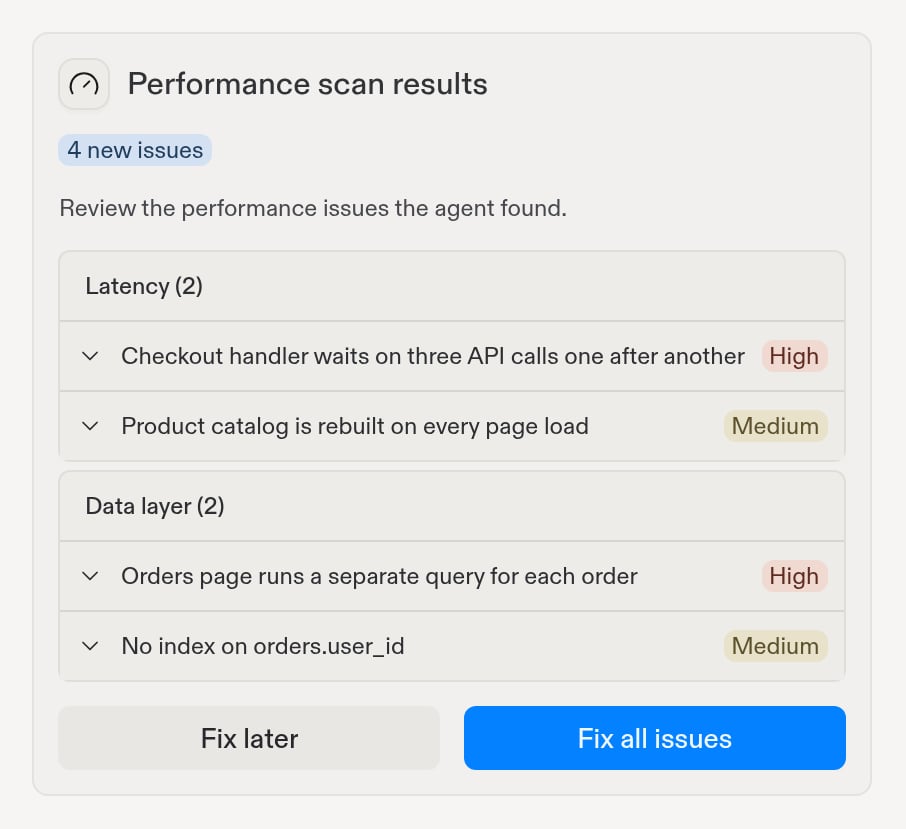
When the scan finishes, a Performance scan results card appears in the scan task. It shows how many new issues Performance Agent found, grouped into Latency and Data layer. Expand an issue to read its summary, or select View issue to open the full details, including the affected files and the recommended fix.
The scan results group new issues by type and severity
Choose what to do next:
Fix all issues: Agent starts a fix task for each group and opens the Monitoring tool so you can track them.
Fix later: closes the results without changing anything. The issues stay in the Performance scan card so you can fix them whenever you’re ready.
If the scan finds nothing new, the card says so and you can select Got it.
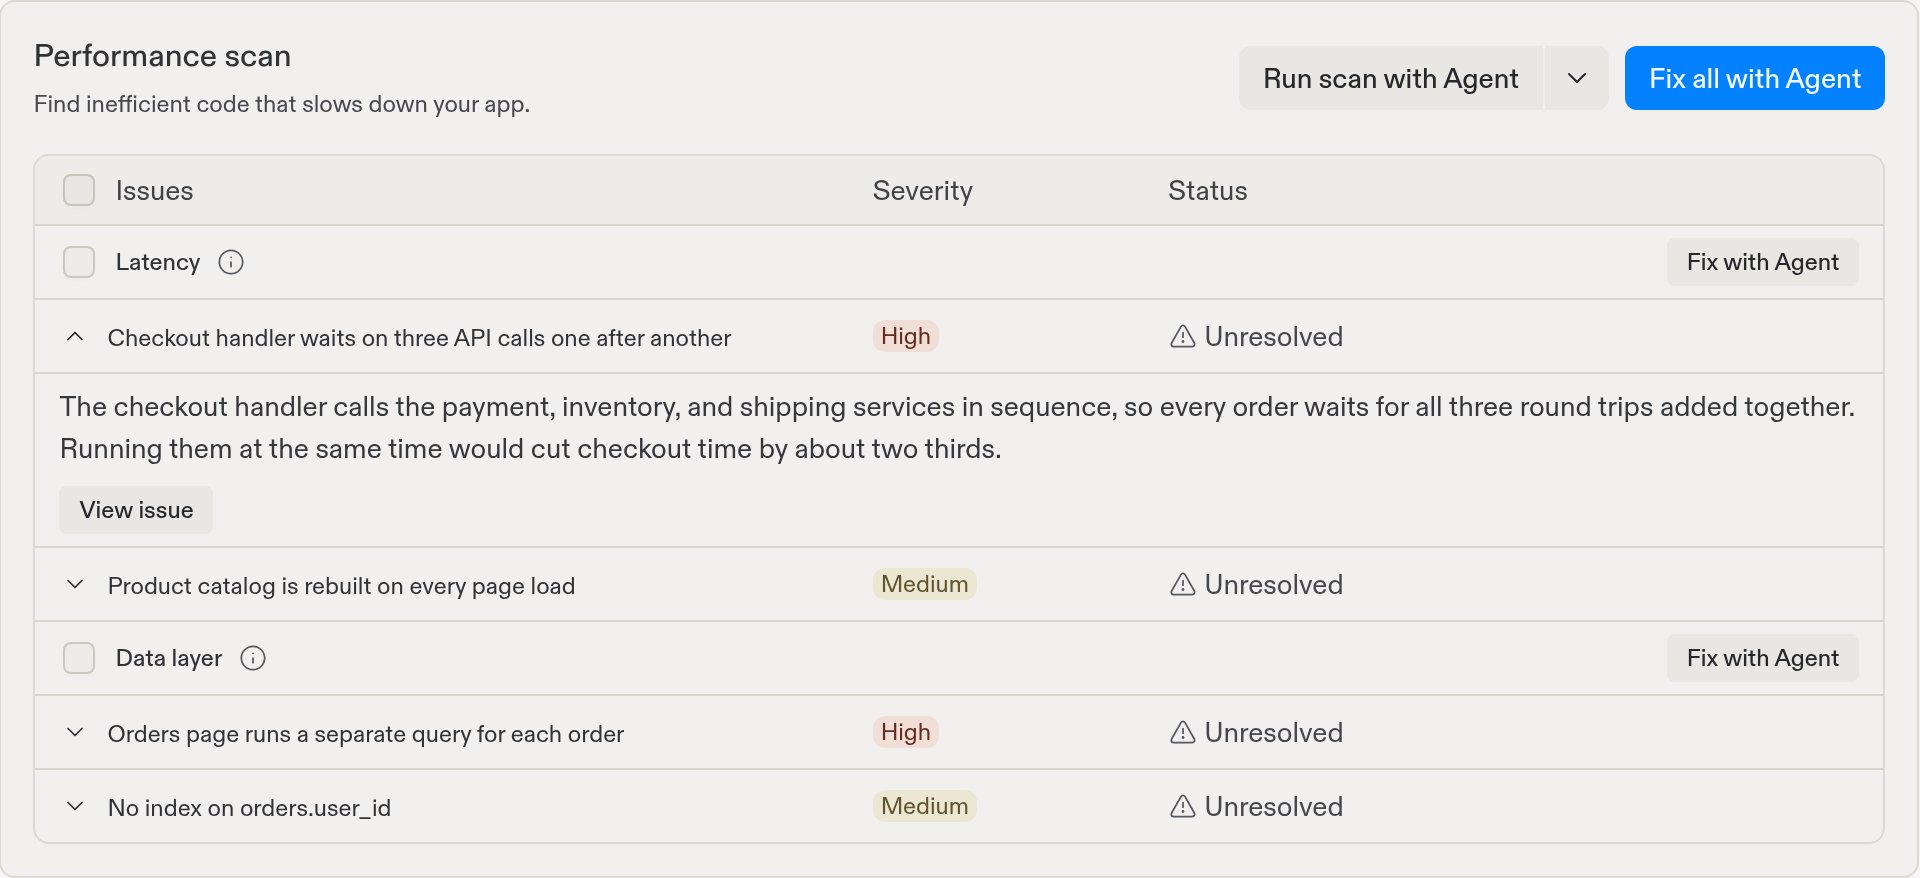
The Performance scan card in the Monitoring tool keeps track of every open issue, including issues from earlier scans. Issues are grouped into Latency and Data layer, with a Severity and a Status for each one. Expand an issue to read its summary, or select View issue to see the full details.
Expand an issue to read its summary, or select View issue for the full details
You can fix issues one group at a time or all at once:
Fix with Agent on a group sends every issue in that group to Agent as one task.
Fix all with Agent sends every open group to Agent.
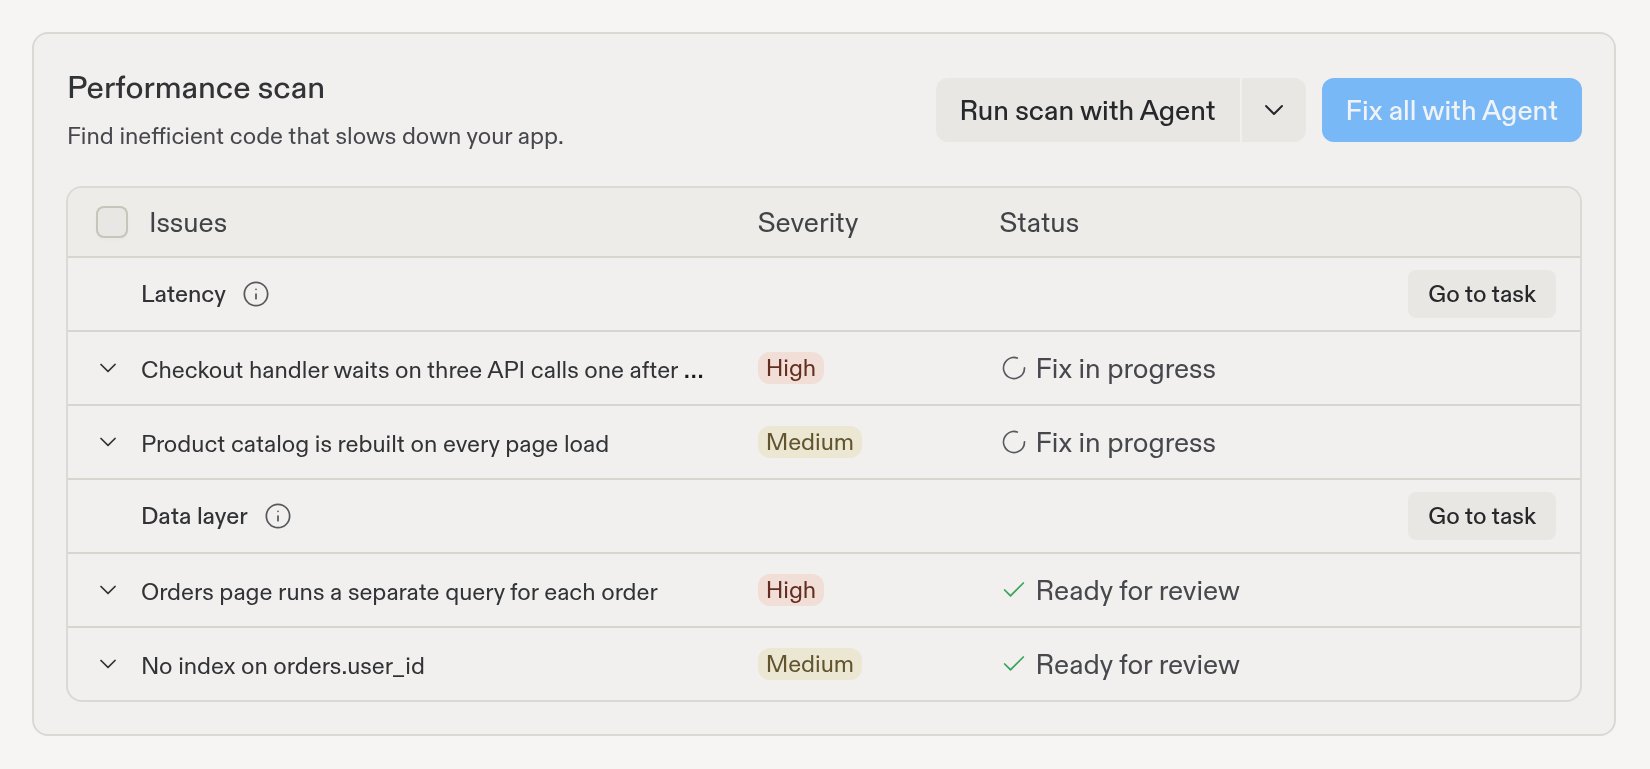
Agent works on each fix task in the background, in parallel, so you can keep building. Each issue’s status updates as the work moves along:
Fix in progress: Agent is working on the fix. Select Go to task to follow along.
Ready for review: the fix is done. Open the task, review the changes, and select Apply changes to main version to add them to your app.
Applying fix: Replit is adding the changes to your app.
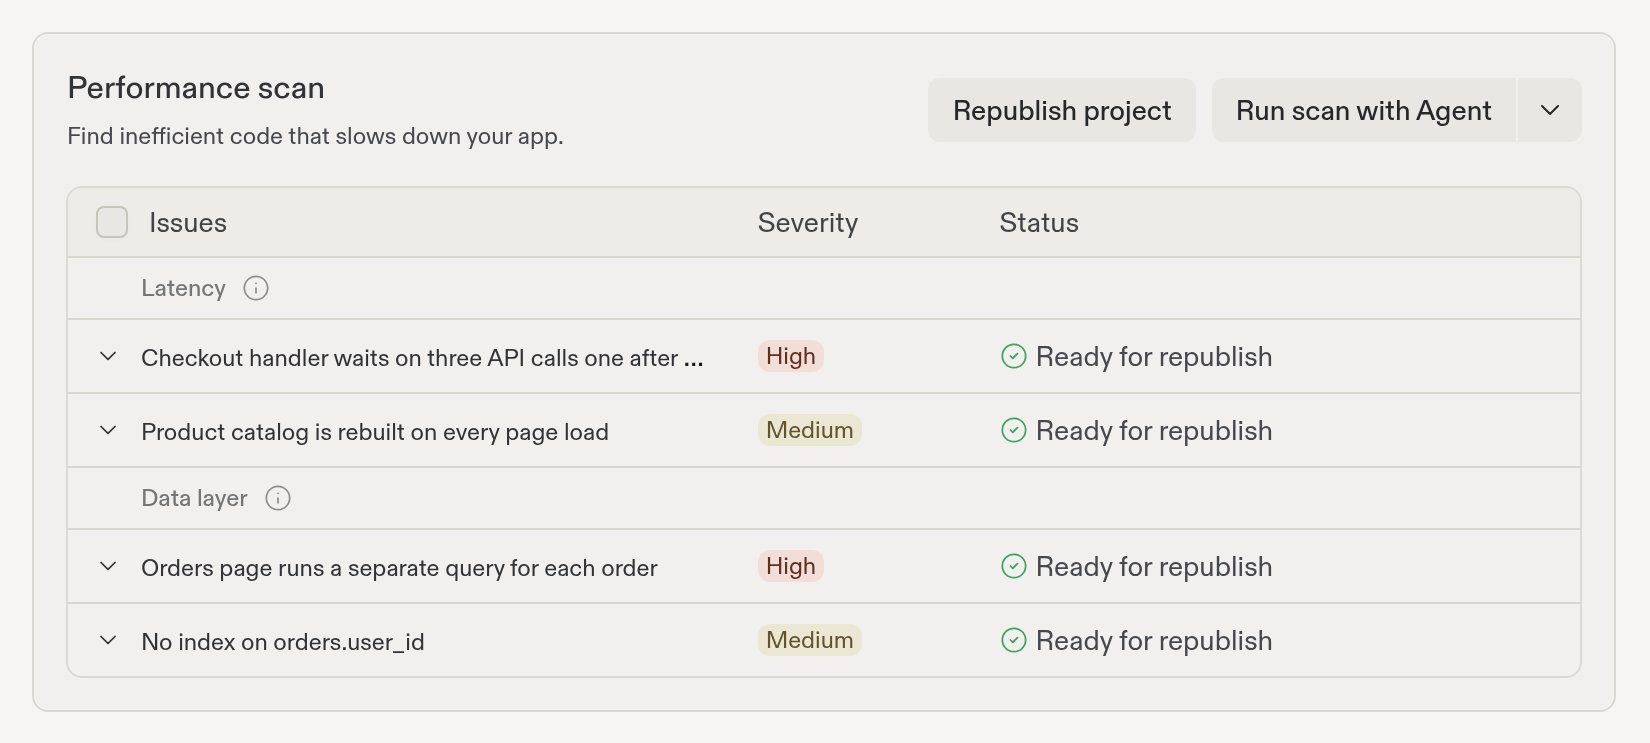
Ready for republish: the fix is in your app but not in your published version yet.
Fixed: the fix is live.
Issue statuses update as Agent works through each fix task
Fixes only reach your visitors after you republish. Once one or more fixes are Ready for republish, a Republish project button appears in the Performance scan card. Select it to publish a new version of your app with the fixes. The status changes to Publishing, then Fixed.
Select Republish project to put your fixes live
You can also republish from the Publishing tool. See After you publish.
After you republish, run another scan with Only scan changes since the last
scan checked. Performance Agent confirms which issues are fixed and checks
your recent changes for new ones.
Both agents live in the Monitoring tool, but they answer different questions:
Performance Agent reviews your code when you ask it to, and finds issues that make your app slow, even before visitors notice them.
Monitoring Agent watches your published app around the clock and investigates production alerts, such as error spikes and slow responses, as they happen.
Use Performance Agent to find and remove slow code. Use Monitoring Agent to catch problems in production.
Track uptime, request durations, resource usage, and logs for your
published app.
Monitoring Agent
Investigate production alerts and attempt fixes automatically.
Machine configuration
Give your app more CPU and memory when it needs more power.
SEO Agent
Run a technical SEO audit and apply one-click fixes.
Was this page helpful?
{"docsConfig":{"theme":"aspen","$schema":"https://mintlify.com/docs.json","name":"Replit","colors":{"primary":"#FF3C00","light":"#FF3C00","dark":"#FF3C00"},"logo":{"light":"https://mintcdn.com/replit/j4of5To8jzehz0JK/logo/light.svg?fit=max\u0026auto=format\u0026n=j4of5To8jzehz0JK\u0026q=85\u0026s=6209cb5927b56fd1781133af05428373","dark":"https://mintcdn.com/replit/j4of5To8jzehz0JK/logo/dark.svg?fit=max\u0026auto=format\u0026n=j4of5To8jzehz0JK\u0026q=85\u0026s=9cbba158300d48c49d8b888e71015495","href":"/welcome"},"favicon":"https://mintcdn.com/replit/CmOMKRnamiqG44eH/favicon.ico?fit=max\u0026auto=format\u0026n=CmOMKRnamiqG44eH\u0026q=85\u0026s=c89a6df6f537373c946c7a5f0ac65475","appearance":{"default":"light"},"background":{"color":{"light":"#F6F5F4","dark":"#1E1E1F"}},"navbar":{"links":[],"primary":{"type":"button","label":"Start Building","href":"https://replit.com?ref=docs"}},"footer":{"socials":{"x":"https://x.com/replit","linkedin":"https://www.linkedin.com/company/repl-it","youtube":"https://www.youtube.com/@replit"}},"seo":{"metatags":{"og:site_name":"Replit Docs","twitter:site":"@replit","twitter:creator":"@replit","author":"Replit"},"indexing":"all"},"fonts":{"heading":{"family":"ABC Diatype Plus","weight":400,"source":"https://cdn.replit.com/dotcom/fonts/ABCDiatypePlusVariable.woff2","format":"woff2"},"body":{"family":"ABC Diatype Plus","weight":400,"source":"https://cdn.replit.com/dotcom/fonts/ABCDiatypePlusVariable.woff2","format":"woff2"}},"integrations":{"segment":{"key":"dMePKGC4BqfBivpe0Hvl8IoPpzSHgjdX"}},"contextual":{"options":["copy","view"],"display":"header"},"thumbnails":{"appearance":"light","background":"https://mintcdn.com/replit/j4of5To8jzehz0JK/thumb.png?fit=max\u0026auto=format\u0026n=j4of5To8jzehz0JK\u0026q=85\u0026s=a7db7f0256b2fa06810fb4d378e63cc5","fonts":{"family":"ABC Diatype Plus"}},"styling":{"latex":true},"navigation":{"languages":[{"language":"en","href":"welcome"},{"language":"fr","navbar":{"links":[],"primary":{"type":"button","label":"Commencer à créer","href":"https://replit.com?ref=docs"}},"href":"fr/welcome"},{"language":"pt","hidden":false,"navbar":{"links":[],"primary":{"type":"button","label":"Comece a criar","href":"https://replit.com?ref=docs"}},"href":"pt/welcome"},{"language":"ja","hidden":false,"navbar":{"links":[],"primary":{"type":"button","label":"作成を開始","href":"https://replit.com?ref=docs"}},"href":"ja/welcome"},{"language":"ko","hidden":false,"navbar":{"links":[],"primary":{"type":"button","label":"빌드 시작하기","href":"https://replit.com?ref=docs"}},"href":"ko/welcome"}]}},"deployment":{"deploymentMetadataValue":{"subdomain":"replit","hasAudioNarration":false,"actualSubdomain":"replit","customDomains":["docs.replit.com","docs.repl.it"],"gitSource":{"type":"github","owner":"replit","repo":"replit-docs","deployBranch":"main","contentDirectory":"docs","isPrivate":true,"mountPath":"","label":""},"feedback":{"thumbs":true,"issues":true,"edits":false},"entitlements":{"AI_CHAT":{"status":"DISABLED"},"REMOVE_BRANDING":{"status":"ENABLED"},"CONTEXTUAL_FEEDBACK":{"status":"ENABLED"},"CODE_SNIPPET_FEEDBACK":{"status":"ENABLED"},"WEB_MCP":{"status":"ENABLED"},"NARRATION":{"status":"DISABLED"}},"buildId":"6af206ce45e61b18b3c351ed","clientVersion":"0.0.4094","searchFilterCounts":[{"language":"en","tag":"Features","count":362},{"language":"fr","tag":"Fonctionnalités","count":360},{"language":"ja","tag":"機能","count":360},{"language":"ko","tag":"기능","count":360},{"language":"pt","tag":"Funcionalidades","count":360},{"language":"en","tag":"Changelog","count":100},{"language":"fr","tag":"Journal des modifications","count":100},{"language":"ja","tag":"変更履歴","count":100},{"language":"ko","tag":"변경 내역","count":100},{"language":"pt","tag":"Registro de alterações","count":100},{"language":"en","tag":"Apps","count":41},{"language":"fr","tag":"Apps","count":41},{"language":"ja","tag":"Apps","count":41},{"language":"ko","tag":"Apps","count":41},{"language":"pt","tag":"Apps","count":41},{"language":"en","tag":"Enterprise","count":40},{"language":"fr","tag":"Entreprise","count":40},{"language":"ja","tag":"Enterprise","count":40},{"language":"ko","tag":"Enterprise","count":40},{"language":"pt","tag":"Enterprise","count":40},{"language":"en","tag":"Use cases","count":39},{"language":"fr","tag":"Use cases","count":39},{"language":"ja","tag":"Use cases","count":39},{"language":"ko","tag":"Use cases","count":39},{"language":"pt","tag":"Use cases","count":39},{"language":"en","tag":"Chats","count":25},{"language":"en","tag":"Designs","count":25},{"language":"fr","tag":"Chats","count":25},{"language":"fr","tag":"Designs","count":25},{"language":"ja","tag":"Chats","count":25},{"language":"ja","tag":"Designs","count":25},{"language":"ko","tag":"Chats","count":25},{"language":"ko","tag":"Designs","count":25},{"language":"pt","tag":"Chats","count":25},{"language":"pt","tag":"Designs","count":25},{"language":"en","tag":"Trust \u0026 Billing","count":23},{"language":"fr","tag":"Confiance et facturation","count":23},{"language":"ja","tag":"信頼と請求","count":23},{"language":"ko","tag":"신뢰 및 결제","count":23},{"language":"pt","tag":"Confiança e faturamento","count":23},{"language":"en","tag":"Web","count":22},{"language":"fr","tag":"Web","count":22},{"language":"ja","tag":"Web","count":22},{"language":"ko","tag":"Web","count":22},{"language":"pt","tag":"Web","count":22},{"language":"en","tag":"Help","count":20},{"language":"fr","tag":"Help","count":20},{"language":"ja","tag":"Help","count":20},{"language":"ko","tag":"Help","count":20},{"language":"pt","tag":"Help","count":20}]},"assistantConfig":{"deflection":{"enabled":true,"email":"support@replit.com"}},"basePath":"","hasChatPermissions":false,"hasWebMcpPermissions":true,"toggles":[{"name":"kill-isr","enabled":true,"variant":{"name":"disabled","enabled":false,"feature_enabled":true},"impressionData":false},{"name":"agent-mintlify-slack","enabled":true,"variant":{"name":"disabled","enabled":false,"feature_enabled":true},"impressionData":false},{"name":"agent-integrations-settings","enabled":true,"variant":{"name":"disabled","enabled":false,"feature_enabled":true},"impressionData":false},{"name":"rbac-expansion","enabled":true,"variant":{"name":"disabled","enabled":false,"feature_enabled":true},"impressionData":false},{"name":"automations-pr-grouping","enabled":true,"variant":{"name":"disabled","enabled":false,"feature_enabled":true},"impressionData":false},{"name":"custom-prefix","enabled":true,"variant":{"name":"disabled","enabled":false,"feature_enabled":true},"impressionData":false},{"name":"analytics-v7","enabled":true,"variant":{"name":"disabled","enabled":false,"feature_enabled":true},"impressionData":false},{"name":"user-flows-analytics","enabled":true,"variant":{"name":"disabled","enabled":false,"feature_enabled":true},"impressionData":false},{"name":"no-publish-flow","enabled":true,"variant":{"name":"disabled","enabled":false,"feature_enabled":true},"impressionData":false},{"name":"workos-onboarding","enabled":true,"variant":{"name":"disabled","enabled":false,"feature_enabled":true},"impressionData":false},{"name":"llms-txt-v2","enabled":true,"variant":{"name":"disabled","enabled":false,"feature_enabled":true},"impressionData":false},{"name":"snapshot-serving-live","enabled":true,"variant":{"name":"disabled","enabled":false,"feature_enabled":true},"impressionData":false},{"name":"stripTemperatureMiddleware","enabled":true,"variant":{"name":"disabled","enabled":false,"feature_enabled":true},"impressionData":false},{"name":"support-platform-pylon-zendesk","enabled":true,"variant":{"name":"disabled","enabled":false,"feature_enabled":true},"impressionData":false},{"name":"snapshot-serving","enabled":true,"variant":{"name":"disabled","enabled":false,"feature_enabled":true},"impressionData":false},{"name":"instant-rollback","enabled":true,"variant":{"name":"disabled","enabled":false,"feature_enabled":true},"impressionData":false},{"name":"granular-notifications-server","enabled":true,"variant":{"name":"disabled","enabled":false,"feature_enabled":true},"impressionData":false},{"name":"granular-notifications","enabled":true,"variant":{"name":"disabled","enabled":false,"feature_enabled":true},"impressionData":false},{"name":"automations-fable","enabled":true,"variant":{"name":"disabled","enabled":false,"feature_enabled":true},"impressionData":false},{"name":"fixed-ai-action-pricing","enabled":true,"variant":{"name":"disabled","enabled":false,"feature_enabled":true},"impressionData":false},{"name":"automation-resolve-merge-conflict","enabled":true,"variant":{"name":"disabled","enabled":false,"feature_enabled":true},"impressionData":false},{"name":"scoped-publishing","enabled":true,"variant":{"name":"disabled","enabled":false,"feature_enabled":true},"impressionData":false},{"name":"mintql","enabled":true,"variant":{"name":"disabled","enabled":false,"feature_enabled":true},"impressionData":false},{"name":"page-level-analytics","enabled":true,"variant":{"name":"disabled","enabled":false,"feature_enabled":true},"impressionData":false},{"name":"editor-version-history-v2","enabled":true,"variant":{"name":"disabled","enabled":false,"feature_enabled":true},"impressionData":false},{"name":"billing-page-v2","enabled":true,"variant":{"name":"disabled","enabled":false,"feature_enabled":true},"impressionData":false},{"name":"full-page-search","enabled":true,"variant":{"name":"disabled","enabled":false,"feature_enabled":true},"impressionData":false},{"name":"workspace-projects","enabled":true,"variant":{"name":"disabled","enabled":false,"feature_enabled":true},"impressionData":false},{"name":"assistant-v5","enabled":true,"variant":{"name":"disabled","enabled":false,"feature_enabled":true},"impressionData":false},{"name":"fork-pr-previews","enabled":true,"variant":{"name":"disabled","enabled":false,"feature_enabled":true},"impressionData":false},{"name":"revalidation-jwt","enabled":true,"variant":{"name":"disabled","enabled":false,"feature_enabled":true},"impressionData":false},{"name":"workos-sso-scim","enabled":true,"variant":{"name":"disabled","enabled":false,"feature_enabled":true},"impressionData":false},{"name":"hobby-abuse-scan","enabled":true,"variant":{"name":"disabled","enabled":false,"feature_enabled":true},"impressionData":false},{"name":"dashboard-inbox","enabled":true,"variant":{"name":"disabled","enabled":false,"feature_enabled":true},"impressionData":false},{"name":"workos-signup","enabled":true,"variant":{"name":"disabled","enabled":false,"feature_enabled":true},"impressionData":false},{"name":"turbopuffer-dual-write","enabled":true,"variant":{"name":"disabled","enabled":false,"feature_enabled":true},"impressionData":false},{"name":"workos-enabled","enabled":true,"variant":{"name":"disabled","enabled":false,"feature_enabled":true},"impressionData":false},{"name":"approve-review-flow","enabled":true,"variant":{"name":"disabled","enabled":false,"feature_enabled":true},"impressionData":false},{"name":"editor-metadata","enabled":true,"variant":{"name":"disabled","enabled":false,"feature_enabled":true},"impressionData":false},{"name":"sso-setup-deadline-banner","enabled":true,"variant":{"name":"disabled","enabled":false,"feature_enabled":true},"impressionData":false},{"name":"turbopuffer-serve","enabled":true,"variant":{"name":"disabled","enabled":false,"feature_enabled":true},"impressionData":false},{"name":"live-agents","enabled":true,"variant":{"name":"disabled","enabled":false,"feature_enabled":true},"impressionData":false},{"name":"comment-mode","enabled":true,"variant":{"name":"disabled","enabled":false,"feature_enabled":true},"impressionData":false}],"googleFontsInlined":false},"customCss":[{"filePath":"styles.css","href":"/_mintlify/custom/replit/795eee5cda55dee3/styles.css"}],"page":{"pagePath":"features/publishing/performance-agent","slug":"/features/publishing/performance-agent","pageMetadata":{"title":"Performance Agent","sidebarTitle":"Performance Agent","description":"Scan your app for slow requests and database bottlenecks with Performance Agent, then fix the issues with Agent and republish.","icon":"gauge-high","href":"/features/publishing/performance-agent"},"description":{"compiledSource":"\"use strict\";\nconst {jsx: _jsx} = arguments[0];\nconst {useMDXComponents: _provideComponents} = arguments[0];\nfunction _createMdxContent(props) {\n const _components = {\n p: \"p\",\n ..._provideComponents(),\n ...props.components\n };\n return _jsx(_components.p, {\n children: \"Scan your app for slow requests and database bottlenecks with Performance Agent, then fix the issues with Agent and republish.\"\n });\n}\nfunction MDXContent(props = {}) {\n const {wrapper: MDXLayout} = {\n ..._provideComponents(),\n ...props.components\n };\n return MDXLayout ? _jsx(MDXLayout, {\n ...props,\n children: _jsx(_createMdxContent, {\n ...props\n })\n }) : _createMdxContent(props);\n}\nreturn {\n default: MDXContent\n};\n","frontmatter":{},"scope":{}},"pageType":"default","mdx":{"mdxSource":{"compiledSource":"\"use strict\";const{Fragment:_Fragment,jsx:_jsx,jsxs:_jsxs}=arguments[0];const{useMDXComponents:_provideComponents}=arguments[0];const AiPrompt=({children})=>{const{CodeBlock}=_provideComponents()||{};if(!CodeBlock)_missingMdxReference(`CodeBlock`,true);return _jsx(CodeBlock,{className:`mint-relative mint-block mint-max-w-full mint-overflow-x-hidden mint-font-sans !mint-whitespace-pre-wrap !mint-break-words`,style:{overflowWrap:`anywhere`,wordBreak:`break-word`},children:_jsx(`div`,{className:`mint-pr-7`,style:{whiteSpace:`pre-wrap`,overflowWrap:`anywhere`,wordBreak:`break-word`},children})})};function _createMdxContent(props){const _components={a:`a`,li:`li`,p:`p`,strong:`strong`,ul:`ul`,..._provideComponents(),...props.components},{Card,CardGroup,Frame,Heading,Note,OptimizedImage,Step,Steps,Tip,_MdxComponentBoundary}=_components;if(!Card)_missingMdxReference(`Card`,true);if(!CardGroup)_missingMdxReference(`CardGroup`,true);if(!Frame)_missingMdxReference(`Frame`,true);if(!Heading)_missingMdxReference(`Heading`,true);if(!Note)_missingMdxReference(`Note`,true);if(!OptimizedImage)_missingMdxReference(`OptimizedImage`,true);if(!Step)_missingMdxReference(`Step`,true);if(!Steps)_missingMdxReference(`Steps`,true);if(!Tip)_missingMdxReference(`Tip`,true);if(!_MdxComponentBoundary)_missingMdxReference(`_MdxComponentBoundary`,true);return _jsxs(_Fragment,{children:[_jsx(_components.p,{children:`Performance Agent reviews your project’s source code and logs to find concrete, fixable problems that make your app slow. Each finding comes with a plain-language summary, a severity, and a recommended fix that Agent can apply for you.`}),`\n`,_jsx(Heading,{level:`2`,id:`what-performance-agent-finds`,children:`What Performance Agent finds`}),`\n`,_jsx(_components.p,{children:`Performance Agent looks for two types of issues. Each type appears as its own group in the results.`}),`\n`,_jsxs(_components.ul,{children:[`\n`,_jsxs(_components.li,{children:[_jsx(_components.strong,{children:`Latency`}),`: parts of your app that make visitors wait. For example, a page might do slow work one step at a time instead of all at once, or repeat the same work on every visit.`]}),`\n`,_jsxs(_components.li,{children:[_jsx(_components.strong,{children:`Data layer`}),`: database problems such as N+1 queries, missing indexes, and loading more data than the page needs.`]}),`\n`]}),`\n`,_jsx(Note,{children:_jsxs(_components.p,{children:[`Performance Agent only reports and fixes issues it can tie to your code. It\ndoesn’t change your machine size or other deployment settings. To give your app\nmore power, see `,_jsx(_components.a,{href:`/features/publishing/machine-configuration`,children:`Machine configuration`}),`.`]})}),`\n`,_jsx(Heading,{level:`2`,id:`before-you-start`,children:`Before you start`}),`\n`,_jsx(_components.p,{children:`Performance Agent requires:`}),`\n`,_jsxs(_components.ul,{children:[`\n`,_jsxs(_components.li,{children:[_jsx(_components.strong,{children:`A paid plan.`}),` Performance Agent is available to builders on a paid plan. If you’re on the free plan, the `,_jsx(_components.strong,{children:`Performance scan`}),` card shows an upgrade option.`]}),`\n`,_jsx(_components.li,{children:_jsx(_components.strong,{children:`Edit access to the project.`})}),`\n`]}),`\n`,_jsx(_components.p,{children:`You can scan an app before you publish it. After you publish, Performance Agent can also use your deployment logs to find endpoints that are slow for real visitors.`}),`\n`,_jsx(_components.p,{children:`The scan only reads your project. It doesn’t change your code, your database, or your published app. Changes only happen when you choose to fix issues.`}),`\n`,_jsx(Heading,{level:`2`,id:`start-a-scan`,children:`Start a scan`}),`\n`,_jsxs(Steps,{children:[_jsx(Step,{title:`Open Monitoring`,children:_jsxs(_components.p,{children:[`In your project’s `,_jsx(_components.strong,{children:`Tools`}),` pane, open `,_jsx(_components.strong,{children:`Monitoring`}),` under `,_jsx(_components.strong,{children:`Replit Cloud`}),`. Scroll to the `,_jsx(_components.strong,{children:`Performance scan`}),` card.`]})}),_jsxs(Step,{title:`Run a scan`,children:[_jsxs(_components.p,{children:[`Select `,_jsx(_components.strong,{children:`Run scan with Agent`}),` to scan your whole project with the default settings.`]}),_jsxs(_components.p,{children:[`To focus the scan, select the arrow next to `,_jsx(_components.strong,{children:`Run scan with Agent`}),` first:`]}),_jsxs(_components.ul,{children:[`\n`,_jsxs(_components.li,{children:[_jsx(_components.strong,{children:`Add context (optional)`}),`: describe the parts of your app you care about, such as “checkout flow and the orders page”.`]}),`\n`,_jsxs(_components.li,{children:[_jsx(_components.strong,{children:`Only scan changes since the last scan`}),`: check this box to review only what changed since your previous scan. Performance Agent also rechecks the issues from that scan to see whether they are still present.`]}),`\n`]}),_jsxs(_components.p,{children:[`Then select `,_jsx(_components.strong,{children:`Start performance scan`}),`.`]}),_jsx(Frame,{caption:`Add context or limit the scan to recent changes before starting it`,children:_jsx(OptimizedImage,{src:`https://mintcdn.com/replit/Ra56mnn_KIIRW4c1/images/deployments/performance-agent/01-start-scan.png?fit=max\u0026auto=format\u0026n=Ra56mnn_KIIRW4c1\u0026q=85\u0026s=f9ff4e8e319bde843e0c9a962b0be247`,alt:`The Performance scan card with the scan options open, showing an Add context field containing Checkout flow and the orders page, a checked Only scan changes since the last scan box, and a Start performance scan button`,\"data-og-width\":`1030`,width:`1030`,\"data-og-height\":`820`,height:`820`,\"data-path\":`images/deployments/performance-agent/01-start-scan.png`,\"data-optimize\":`true`,\"data-opv\":`3`,srcset:`https://mintcdn.com/replit/Ra56mnn_KIIRW4c1/images/deployments/performance-agent/01-start-scan.png?w=280\u0026fit=max\u0026auto=format\u0026n=Ra56mnn_KIIRW4c1\u0026q=85\u0026s=ea72145b2a3ddaf00b7d10e82775be2b 280w, https://mintcdn.com/replit/Ra56mnn_KIIRW4c1/images/deployments/performance-agent/01-start-scan.png?w=560\u0026fit=max\u0026auto=format\u0026n=Ra56mnn_KIIRW4c1\u0026q=85\u0026s=4e40cddab82c0280f026f9001744fb41 560w, https://mintcdn.com/replit/Ra56mnn_KIIRW4c1/images/deployments/performance-agent/01-start-scan.png?w=840\u0026fit=max\u0026auto=format\u0026n=Ra56mnn_KIIRW4c1\u0026q=85\u0026s=0e7a96fa5eef46ba9936fe7d96e1755e 840w, https://mintcdn.com/replit/Ra56mnn_KIIRW4c1/images/deployments/performance-agent/01-start-scan.png?w=1100\u0026fit=max\u0026auto=format\u0026n=Ra56mnn_KIIRW4c1\u0026q=85\u0026s=41611b452c33bdf0f3b1124698d193c9 1100w, https://mintcdn.com/replit/Ra56mnn_KIIRW4c1/images/deployments/performance-agent/01-start-scan.png?w=1650\u0026fit=max\u0026auto=format\u0026n=Ra56mnn_KIIRW4c1\u0026q=85\u0026s=721b238a67abea18e72d78ff0e98ef01 1650w, https://mintcdn.com/replit/Ra56mnn_KIIRW4c1/images/deployments/performance-agent/01-start-scan.png?w=2500\u0026fit=max\u0026auto=format\u0026n=Ra56mnn_KIIRW4c1\u0026q=85\u0026s=96e0ba62dfe571cea64f8bbcc3463e57 2500w`})})]}),_jsx(Step,{title:`Wait for the results`,children:_jsxs(_components.p,{children:[`The scan runs as a separate task, so you can keep building. While it runs, the card shows `,_jsx(_components.strong,{children:`Scan in progress`}),`. A scan usually takes a few minutes. Select `,_jsx(_components.strong,{children:`Go to task`}),` to follow along.`]})})]}),`\n`,_jsx(_components.p,{children:`You can also ask Agent to start a scan from the chat:`}),`\n`,_jsx(_MdxComponentBoundary,{name:`AiPrompt`,children:_jsx(AiPrompt,{children:`Run a performance scan on my app.`})}),`\n`,_jsx(Heading,{level:`2`,id:`review-the-results`,children:`Review the results`}),`\n`,_jsxs(_components.p,{children:[`When the scan finishes, a `,_jsx(_components.strong,{children:`Performance scan results`}),` card appears in the scan task. It shows how many new issues Performance Agent found, grouped into `,_jsx(_components.strong,{children:`Latency`}),` and `,_jsx(_components.strong,{children:`Data layer`}),`. Expand an issue to read its summary, or select `,_jsx(_components.strong,{children:`View issue`}),` to open the full details, including the affected files and the recommended fix.`]}),`\n`,_jsx(Frame,{caption:`The scan results group new issues by type and severity`,children:_jsx(OptimizedImage,{src:`https://mintcdn.com/replit/Ra56mnn_KIIRW4c1/images/deployments/performance-agent/02-scan-results.png?fit=max\u0026auto=format\u0026n=Ra56mnn_KIIRW4c1\u0026q=85\u0026s=177c56d4b8b55cca76a02f2d0f37527d`,alt:`The Performance scan results card showing 4 new issues in two groups, Latency and Data layer, each issue with a High or Medium severity label, and Fix later and Fix all issues buttons`,\"data-og-width\":`906`,width:`906`,\"data-og-height\":`829`,height:`829`,\"data-path\":`images/deployments/performance-agent/02-scan-results.png`,\"data-optimize\":`true`,\"data-opv\":`3`,srcset:`https://mintcdn.com/replit/Ra56mnn_KIIRW4c1/images/deployments/performance-agent/02-scan-results.png?w=280\u0026fit=max\u0026auto=format\u0026n=Ra56mnn_KIIRW4c1\u0026q=85\u0026s=eb2b2e8380f8a2f873ed5d0646d26438 280w, https://mintcdn.com/replit/Ra56mnn_KIIRW4c1/images/deployments/performance-agent/02-scan-results.png?w=560\u0026fit=max\u0026auto=format\u0026n=Ra56mnn_KIIRW4c1\u0026q=85\u0026s=1d3cf91d6129b5f816f9426d65386db4 560w, https://mintcdn.com/replit/Ra56mnn_KIIRW4c1/images/deployments/performance-agent/02-scan-results.png?w=840\u0026fit=max\u0026auto=format\u0026n=Ra56mnn_KIIRW4c1\u0026q=85\u0026s=e8f7d63dd1bb964bfff70c6b29166008 840w, https://mintcdn.com/replit/Ra56mnn_KIIRW4c1/images/deployments/performance-agent/02-scan-results.png?w=1100\u0026fit=max\u0026auto=format\u0026n=Ra56mnn_KIIRW4c1\u0026q=85\u0026s=2986c9d4c3f7879d7520295fb2bf32eb 1100w, https://mintcdn.com/replit/Ra56mnn_KIIRW4c1/images/deployments/performance-agent/02-scan-results.png?w=1650\u0026fit=max\u0026auto=format\u0026n=Ra56mnn_KIIRW4c1\u0026q=85\u0026s=af85d74de9b69c0fb4b96b6862969db8 1650w, https://mintcdn.com/replit/Ra56mnn_KIIRW4c1/images/deployments/performance-agent/02-scan-results.png?w=2500\u0026fit=max\u0026auto=format\u0026n=Ra56mnn_KIIRW4c1\u0026q=85\u0026s=1470bbcc8960a86fe04a96ba7ba2b88b 2500w`})}),`\n`,_jsx(_components.p,{children:`Choose what to do next:`}),`\n`,_jsxs(_components.ul,{children:[`\n`,_jsxs(_components.li,{children:[_jsx(_components.strong,{children:`Fix all issues`}),`: Agent starts a fix task for each group and opens the `,_jsx(_components.strong,{children:`Monitoring`}),` tool so you can track them.`]}),`\n`,_jsxs(_components.li,{children:[_jsx(_components.strong,{children:`Fix later`}),`: closes the results without changing anything. The issues stay in the `,_jsx(_components.strong,{children:`Performance scan`}),` card so you can fix them whenever you’re ready.`]}),`\n`]}),`\n`,_jsxs(_components.p,{children:[`If the scan finds nothing new, the card says so and you can select `,_jsx(_components.strong,{children:`Got it`}),`.`]}),`\n`,_jsx(Heading,{level:`2`,id:`fix-issues-from-monitoring`,children:`Fix issues from Monitoring`}),`\n`,_jsxs(_components.p,{children:[`The `,_jsx(_components.strong,{children:`Performance scan`}),` card in the `,_jsx(_components.strong,{children:`Monitoring`}),` tool keeps track of every open issue, including issues from earlier scans. Issues are grouped into `,_jsx(_components.strong,{children:`Latency`}),` and `,_jsx(_components.strong,{children:`Data layer`}),`, with a `,_jsx(_components.strong,{children:`Severity`}),` and a `,_jsx(_components.strong,{children:`Status`}),` for each one. Expand an issue to read its summary, or select `,_jsx(_components.strong,{children:`View issue`}),` to see the full details.`]}),`\n`,_jsx(Frame,{caption:`Expand an issue to read its summary, or select View issue for the full details`,children:_jsx(OptimizedImage,{src:`https://mintcdn.com/replit/Ra56mnn_KIIRW4c1/images/deployments/performance-agent/03-monitoring-issues.png?fit=max\u0026auto=format\u0026n=Ra56mnn_KIIRW4c1\u0026q=85\u0026s=0a7179ccd7324d6f663537db0c13436c`,alt:`The Performance scan card in the Monitoring tool with a table of issues grouped under Latency and Data layer, severity labels, and an Unresolved status on each issue. The first Latency issue is expanded to show its summary and a View issue button. Each group has a Fix with Agent button and the header has a Fix all with Agent button`,\"data-og-width\":`1920`,width:`1920`,\"data-og-height\":`878`,height:`878`,\"data-path\":`images/deployments/performance-agent/03-monitoring-issues.png`,\"data-optimize\":`true`,\"data-opv\":`3`,srcset:`https://mintcdn.com/replit/Ra56mnn_KIIRW4c1/images/deployments/performance-agent/03-monitoring-issues.png?w=280\u0026fit=max\u0026auto=format\u0026n=Ra56mnn_KIIRW4c1\u0026q=85\u0026s=ec2aa117e1f0620978d281703501b431 280w, https://mintcdn.com/replit/Ra56mnn_KIIRW4c1/images/deployments/performance-agent/03-monitoring-issues.png?w=560\u0026fit=max\u0026auto=format\u0026n=Ra56mnn_KIIRW4c1\u0026q=85\u0026s=d69813a1d0b3dfcb7e07edf5eb508da0 560w, https://mintcdn.com/replit/Ra56mnn_KIIRW4c1/images/deployments/performance-agent/03-monitoring-issues.png?w=840\u0026fit=max\u0026auto=format\u0026n=Ra56mnn_KIIRW4c1\u0026q=85\u0026s=9ba6c361bd7cc1f5827631143f00bdd3 840w, https://mintcdn.com/replit/Ra56mnn_KIIRW4c1/images/deployments/performance-agent/03-monitoring-issues.png?w=1100\u0026fit=max\u0026auto=format\u0026n=Ra56mnn_KIIRW4c1\u0026q=85\u0026s=2cab1e5012a6f883e36ebbb315b5d8f9 1100w, https://mintcdn.com/replit/Ra56mnn_KIIRW4c1/images/deployments/performance-agent/03-monitoring-issues.png?w=1650\u0026fit=max\u0026auto=format\u0026n=Ra56mnn_KIIRW4c1\u0026q=85\u0026s=43d51dae650148cfac7e39e5d3aafff6 1650w, https://mintcdn.com/replit/Ra56mnn_KIIRW4c1/images/deployments/performance-agent/03-monitoring-issues.png?w=2500\u0026fit=max\u0026auto=format\u0026n=Ra56mnn_KIIRW4c1\u0026q=85\u0026s=8635fe35af0d4c33c0e27f69d41b34eb 2500w`})}),`\n`,_jsx(_components.p,{children:`You can fix issues one group at a time or all at once:`}),`\n`,_jsxs(_components.ul,{children:[`\n`,_jsxs(_components.li,{children:[_jsx(_components.strong,{children:`Fix with Agent`}),` on a group sends every issue in that group to Agent as one task.`]}),`\n`,_jsxs(_components.li,{children:[_jsx(_components.strong,{children:`Fix all with Agent`}),` sends every open group to Agent.`]}),`\n`]}),`\n`,_jsx(_components.p,{children:`Agent works on each fix task in the background, in parallel, so you can keep building. Each issue’s status updates as the work moves along:`}),`\n`,_jsxs(_components.ul,{children:[`\n`,_jsxs(_components.li,{children:[_jsx(_components.strong,{children:`Fix in progress`}),`: Agent is working on the fix. Select `,_jsx(_components.strong,{children:`Go to task`}),` to follow along.`]}),`\n`,_jsxs(_components.li,{children:[_jsx(_components.strong,{children:`Ready for review`}),`: the fix is done. Open the task, review the changes, and select `,_jsx(_components.strong,{children:`Apply changes to main version`}),` to add them to your app.`]}),`\n`,_jsxs(_components.li,{children:[_jsx(_components.strong,{children:`Applying fix`}),`: Replit is adding the changes to your app.`]}),`\n`,_jsxs(_components.li,{children:[_jsx(_components.strong,{children:`Ready for republish`}),`: the fix is in your app but not in your published version yet.`]}),`\n`,_jsxs(_components.li,{children:[_jsx(_components.strong,{children:`Fixed`}),`: the fix is live.`]}),`\n`]}),`\n`,_jsx(Frame,{caption:`Issue statuses update as Agent works through each fix task`,children:_jsx(OptimizedImage,{src:`https://mintcdn.com/replit/Ra56mnn_KIIRW4c1/images/deployments/performance-agent/04-fixes-in-progress.png?fit=max\u0026auto=format\u0026n=Ra56mnn_KIIRW4c1\u0026q=85\u0026s=af3c795ecfb5ff06829e2d0f4ee55fa9`,alt:`The Performance scan card with Latency issues showing Fix in progress, Data layer issues showing Ready for review, and a Go to task button on each group`,\"data-og-width\":`1650`,width:`1650`,\"data-og-height\":`769`,height:`769`,\"data-path\":`images/deployments/performance-agent/04-fixes-in-progress.png`,\"data-optimize\":`true`,\"data-opv\":`3`,srcset:`https://mintcdn.com/replit/Ra56mnn_KIIRW4c1/images/deployments/performance-agent/04-fixes-in-progress.png?w=280\u0026fit=max\u0026auto=format\u0026n=Ra56mnn_KIIRW4c1\u0026q=85\u0026s=1f452e8ba04eaa4db50c859765a63ea7 280w, https://mintcdn.com/replit/Ra56mnn_KIIRW4c1/images/deployments/performance-agent/04-fixes-in-progress.png?w=560\u0026fit=max\u0026auto=format\u0026n=Ra56mnn_KIIRW4c1\u0026q=85\u0026s=665e374b5165da29655df037fb9b7c59 560w, https://mintcdn.com/replit/Ra56mnn_KIIRW4c1/images/deployments/performance-agent/04-fixes-in-progress.png?w=840\u0026fit=max\u0026auto=format\u0026n=Ra56mnn_KIIRW4c1\u0026q=85\u0026s=e25d032324d321885bc5f971a15cead7 840w, https://mintcdn.com/replit/Ra56mnn_KIIRW4c1/images/deployments/performance-agent/04-fixes-in-progress.png?w=1100\u0026fit=max\u0026auto=format\u0026n=Ra56mnn_KIIRW4c1\u0026q=85\u0026s=f94edddc28ce3cbc8e95ad80ad1368bc 1100w, https://mintcdn.com/replit/Ra56mnn_KIIRW4c1/images/deployments/performance-agent/04-fixes-in-progress.png?w=1650\u0026fit=max\u0026auto=format\u0026n=Ra56mnn_KIIRW4c1\u0026q=85\u0026s=c796c4b85a018b6e049a202027659b7d 1650w, https://mintcdn.com/replit/Ra56mnn_KIIRW4c1/images/deployments/performance-agent/04-fixes-in-progress.png?w=2500\u0026fit=max\u0026auto=format\u0026n=Ra56mnn_KIIRW4c1\u0026q=85\u0026s=61dd22de999cad36fbd64395666fb9f2 2500w`})}),`\n`,_jsx(Heading,{level:`2`,id:`republish-to-apply-your-fixes`,children:`Republish to apply your fixes`}),`\n`,_jsxs(_components.p,{children:[`Fixes only reach your visitors after you republish. Once one or more fixes are `,_jsx(_components.strong,{children:`Ready for republish`}),`, a `,_jsx(_components.strong,{children:`Republish project`}),` button appears in the `,_jsx(_components.strong,{children:`Performance scan`}),` card. Select it to publish a new version of your app with the fixes. The status changes to `,_jsx(_components.strong,{children:`Publishing`}),`, then `,_jsx(_components.strong,{children:`Fixed`}),`.`]}),`\n`,_jsx(Frame,{caption:`Select Republish project to put your fixes live`,children:_jsx(OptimizedImage,{src:`https://mintcdn.com/replit/Ra56mnn_KIIRW4c1/images/deployments/performance-agent/05-republish.png?fit=max\u0026auto=format\u0026n=Ra56mnn_KIIRW4c1\u0026q=85\u0026s=0afaf8a0aa81222fc43646a95f6e0e15`,alt:`The Performance scan card with every issue marked Ready for republish and a Republish project button in the header next to Run scan with Agent`,\"data-og-width\":`1650`,width:`1650`,\"data-og-height\":`743`,height:`743`,\"data-path\":`images/deployments/performance-agent/05-republish.png`,\"data-optimize\":`true`,\"data-opv\":`3`,srcset:`https://mintcdn.com/replit/Ra56mnn_KIIRW4c1/images/deployments/performance-agent/05-republish.png?w=280\u0026fit=max\u0026auto=format\u0026n=Ra56mnn_KIIRW4c1\u0026q=85\u0026s=2c136db58752dc54e5a9d63dfb71d12a 280w, https://mintcdn.com/replit/Ra56mnn_KIIRW4c1/images/deployments/performance-agent/05-republish.png?w=560\u0026fit=max\u0026auto=format\u0026n=Ra56mnn_KIIRW4c1\u0026q=85\u0026s=80d0ebca7df107488a75817bb352191d 560w, https://mintcdn.com/replit/Ra56mnn_KIIRW4c1/images/deployments/performance-agent/05-republish.png?w=840\u0026fit=max\u0026auto=format\u0026n=Ra56mnn_KIIRW4c1\u0026q=85\u0026s=04b59126b02361cbbf8f0141a8403a5f 840w, https://mintcdn.com/replit/Ra56mnn_KIIRW4c1/images/deployments/performance-agent/05-republish.png?w=1100\u0026fit=max\u0026auto=format\u0026n=Ra56mnn_KIIRW4c1\u0026q=85\u0026s=05f5dbd18a133370ef630e773de6af28 1100w, https://mintcdn.com/replit/Ra56mnn_KIIRW4c1/images/deployments/performance-agent/05-republish.png?w=1650\u0026fit=max\u0026auto=format\u0026n=Ra56mnn_KIIRW4c1\u0026q=85\u0026s=be7c5a756aa9f55d1ac749946de388b2 1650w, https://mintcdn.com/replit/Ra56mnn_KIIRW4c1/images/deployments/performance-agent/05-republish.png?w=2500\u0026fit=max\u0026auto=format\u0026n=Ra56mnn_KIIRW4c1\u0026q=85\u0026s=3fca6a66b282ef29bb393de04882363b 2500w`})}),`\n`,_jsxs(_components.p,{children:[`You can also republish from the `,_jsx(_components.strong,{children:`Publishing`}),` tool. See `,_jsx(_components.a,{href:`/features/publishing/after-you-publish`,children:`After you publish`}),`.`]}),`\n`,_jsx(Tip,{children:_jsxs(_components.p,{children:[`After you republish, run another scan with `,_jsx(_components.strong,{children:`Only scan changes since the last\nscan`}),` checked. Performance Agent confirms which issues are fixed and checks\nyour recent changes for new ones.`]})}),`\n`,_jsx(Heading,{level:`2`,id:`performance-agent-and-monitoring-agent`,children:`Performance Agent and Monitoring Agent`}),`\n`,_jsxs(_components.p,{children:[`Both agents live in the `,_jsx(_components.strong,{children:`Monitoring`}),` tool, but they answer different questions:`]}),`\n`,_jsxs(_components.ul,{children:[`\n`,_jsxs(_components.li,{children:[_jsx(_components.strong,{children:`Performance Agent`}),` reviews your code when you ask it to, and finds issues that make your app slow, even before visitors notice them.`]}),`\n`,_jsxs(_components.li,{children:[_jsx(_components.strong,{children:_jsx(_components.a,{href:`/features/publishing/monitoring-agent`,children:`Monitoring Agent`})}),` watches your published app around the clock and investigates production alerts, such as error spikes and slow responses, as they happen.`]}),`\n`]}),`\n`,_jsx(_components.p,{children:`Use Performance Agent to find and remove slow code. Use Monitoring Agent to catch problems in production.`}),`\n`,_jsx(Heading,{level:`2`,id:`next-steps`,children:`Next steps`}),`\n`,_jsxs(CardGroup,{cols:2,children:[_jsx(Card,{title:`Monitor your app`,icon:`chart-line`,href:`/features/publishing/monitoring-a-deployment`,children:_jsx(_components.p,{children:`Track uptime, request durations, resource usage, and logs for your\npublished app.`})}),_jsx(Card,{title:`Monitoring Agent`,icon:`robot`,href:`/features/publishing/monitoring-agent`,children:_jsx(_components.p,{children:`Investigate production alerts and attempt fixes automatically.`})}),_jsx(Card,{title:`Machine configuration`,icon:`microchip`,href:`/features/publishing/machine-configuration`,children:_jsx(_components.p,{children:`Give your app more CPU and memory when it needs more power.`})}),_jsx(Card,{title:`SEO Agent`,icon:`magnifying-glass-chart`,href:`/features/publishing/seo-agent`,children:_jsx(_components.p,{children:`Run a technical SEO audit and apply one-click fixes.`})})]})]})}function MDXContent(props={}){const{wrapper:MDXLayout}={..._provideComponents(),...props.components};return MDXLayout?_jsx(MDXLayout,{...props,children:_jsx(_createMdxContent,{...props})}):_createMdxContent(props)}return{AiPrompt,default:MDXContent};function _missingMdxReference(id,component){throw new Error(`Expected `+(component?`component`:`object`)+\" `\"+id+\"` to be defined: you likely forgot to import, pass, or provide it.\")}","frontmatter":{},"scope":{"config":{},"pageMetadata":{"title":"Performance Agent","sidebarTitle":"Performance Agent","description":"Scan your app for slow requests and database bottlenecks with Performance Agent, then fix the issues with Agent and republish.","icon":"gauge-high","href":"/features/publishing/performance-agent"}}},"mdxSourceWithNoJs":null,"noJsSplices":[[144,612,")=>null;function _cr"]]},"mdxExtracts":{"tableOfContents":[{"title":"What Performance Agent finds","slug":"what-performance-agent-finds","depth":2,"children":[]},{"title":"Before you start","slug":"before-you-start","depth":2,"children":[]},{"title":"Start a scan","slug":"start-a-scan","depth":2,"children":[]},{"title":"Review the results","slug":"review-the-results","depth":2,"children":[]},{"title":"Fix issues from Monitoring","slug":"fix-issues-from-monitoring","depth":2,"children":[]},{"title":"Republish to apply your fixes","slug":"republish-to-apply-your-fixes","depth":2,"children":[]},{"title":"Performance Agent and Monitoring Agent","slug":"performance-agent-and-monitoring-agent","depth":2,"children":[]},{"title":"Next steps","slug":"next-steps","depth":2,"children":[]}],"codeExamples":{}},"jsLinks":[],"dynamicCss":".mint-relative {\n position: relative\n}\n.mint-block {\n display: block\n}\n.mint-max-w-full {\n max-width: 100%\n}\n.mint-overflow-x-hidden {\n overflow-x: hidden\n}\n.\\!mint-whitespace-pre-wrap {\n white-space: pre-wrap !important\n}\n.\\!mint-break-words {\n overflow-wrap: break-word !important\n}\n.mint-pr-7 {\n padding-right: 1.75rem\n}\n.mint-font-sans {\n font-family: ui-sans-serif, system-ui, sans-serif, \"Apple Color Emoji\", \"Segoe UI Emoji\", \"Segoe UI Symbol\", \"Noto Color Emoji\"\n}","subdomain":"replit","siteName":"Replit","title":"Performance Agent - Replit","navMaps":{"firstHrefInVersion":{},"firstHrefInLanguage":{"en":{"href":"/features/publishing/performance-agent","matchLevel":0},"fr":{"href":"/fr/welcome","matchLevel":4},"pt":{"href":"/pt/welcome","matchLevel":4},"ja":{"href":"/ja/welcome","matchLevel":4},"ko":{"href":"/ko/welcome","matchLevel":4}}},"lastModified":"2026-11-09T17:46:33.023Z","originalFileLocation":"features/publishing/performance-agent.mdx","locale":"en"},"headHtml":"\u003cscript data-mint-head>(function(){var d=document.documentElement,p=null;if(!p){try{p=localStorage.getItem(\"isDarkMode\")}catch(e){}if(p==='true')p='dark';else if(p==='false')p='light';if(p!=='light'\u0026\u0026p!=='dark'\u0026\u0026p!=='system')p=\"light\"}var r=p==='system'?(matchMedia(\"(prefers-color-scheme: dark)\").matches?'dark':'light'):p;d.classList.remove(r==='dark'?'light':'dark');d.classList.add(r);d.setAttribute(\"data-theme-preference\",p)})();\u003c/script>\u003cmeta data-mint-head name=\"description\" content=\"Scan your app for slow requests and database bottlenecks with Performance Agent, then fix the issues with Agent and republish.\">\u003cmeta data-mint-head name=\"application-name\" content=\"Replit\">\u003cmeta data-mint-head name=\"generator\" content=\"Mintlify\">\u003clink data-mint-head rel=\"icon\" type=\"image/png\" sizes=\"192x192\" href=\"/mintlify-assets/_mintlify/favicons/replit/bmCuvIiWqqoyeE2o/_generated/favicon/android-chrome-192x192.png\" media=\"(prefers-color-scheme: light)\">\u003clink data-mint-head rel=\"apple-touch-icon\" type=\"image/png\" sizes=\"180x180\" href=\"/mintlify-assets/_mintlify/favicons/replit/bmCuvIiWqqoyeE2o/_generated/favicon/apple-touch-icon.png\">\u003clink data-mint-head rel=\"icon\" type=\"image/png\" sizes=\"16x16\" href=\"/mintlify-assets/_mintlify/favicons/replit/bmCuvIiWqqoyeE2o/_generated/favicon/favicon-16x16.png\" media=\"(prefers-color-scheme: light)\">\u003clink data-mint-head rel=\"icon\" type=\"image/png\" sizes=\"32x32\" href=\"/mintlify-assets/_mintlify/favicons/replit/bmCuvIiWqqoyeE2o/_generated/favicon/favicon-32x32.png\" media=\"(prefers-color-scheme: light)\">\u003clink data-mint-head rel=\"shortcut icon\" type=\"image/x-icon\" href=\"/mintlify-assets/_mintlify/favicons/replit/bmCuvIiWqqoyeE2o/_generated/favicon/favicon.ico\" media=\"(prefers-color-scheme: light)\">\u003clink data-mint-head rel=\"icon\" type=\"image/png\" sizes=\"192x192\" href=\"/mintlify-assets/_mintlify/favicons/replit/bmCuvIiWqqoyeE2o/_generated/favicon-dark/android-chrome-192x192.png\" media=\"(prefers-color-scheme: dark)\">\u003clink data-mint-head rel=\"icon\" type=\"image/png\" sizes=\"16x16\" href=\"/mintlify-assets/_mintlify/favicons/replit/bmCuvIiWqqoyeE2o/_generated/favicon-dark/favicon-16x16.png\" media=\"(prefers-color-scheme: dark)\">\u003clink data-mint-head rel=\"icon\" type=\"image/png\" sizes=\"32x32\" href=\"/mintlify-assets/_mintlify/favicons/replit/bmCuvIiWqqoyeE2o/_generated/favicon-dark/favicon-32x32.png\" media=\"(prefers-color-scheme: dark)\">\u003clink data-mint-head rel=\"shortcut icon\" type=\"image/x-icon\" href=\"/mintlify-assets/_mintlify/favicons/replit/bmCuvIiWqqoyeE2o/_generated/favicon-dark/favicon.ico\" media=\"(prefers-color-scheme: dark)\">\u003cmeta data-mint-head property=\"og:title\" content=\"Performance Agent - Replit\">\u003cmeta data-mint-head property=\"og:description\" content=\"Scan your app for slow requests and database bottlenecks with Performance Agent, then fix the issues with Agent and republish.\">\u003cmeta data-mint-head property=\"og:site_name\" content=\"Replit Docs\">\u003cmeta data-mint-head property=\"og:url\" content=\"https://docs.replit.com/features/publishing/performance-agent\">\u003cmeta data-mint-head property=\"og:type\" content=\"website\">\u003cmeta data-mint-head property=\"og:image\" content=\"https://replit.mintlify.site/_mintlify/api/og/v2?division=Monitoring\u0026amp;title=Performance+Agent\u0026amp;description=Scan+your+app+for+slow+requests+and+database+bottlenecks+with+Performance+Agent%2C+then+fix+the+issues+with+Agent+and+republish.\u0026amp;theme=3d900b3257a00c38c6803774\u0026amp;signature=42cf408153f5841e0beb020bbd87eb698272ada68c25a0bc6922522277d45444\">\u003cmeta data-mint-head property=\"og:image:width\" content=\"1200\">\u003cmeta data-mint-head property=\"og:image:height\" content=\"630\">\u003cmeta data-mint-head name=\"twitter:card\" content=\"summary_large_image\">\u003cmeta data-mint-head name=\"twitter:title\" content=\"Performance Agent - Replit\">\u003cmeta data-mint-head name=\"twitter:description\" content=\"Scan your app for slow requests and database bottlenecks with Performance Agent, then fix the issues with Agent and republish.\">\u003cmeta data-mint-head name=\"twitter:image\" content=\"https://replit.mintlify.site/_mintlify/api/og/v2?division=Monitoring\u0026amp;title=Performance+Agent\u0026amp;description=Scan+your+app+for+slow+requests+and+database+bottlenecks+with+Performance+Agent%2C+then+fix+the+issues+with+Agent+and+republish.\u0026amp;theme=3d900b3257a00c38c6803774\u0026amp;signature=42cf408153f5841e0beb020bbd87eb698272ada68c25a0bc6922522277d45444\">\u003cmeta data-mint-head name=\"twitter:image:width\" content=\"1200\">\u003cmeta data-mint-head name=\"twitter:image:height\" content=\"630\">\u003cmeta data-mint-head name=\"msapplication-config\" content=\"/mintlify-assets/_mintlify/favicons/replit/bmCuvIiWqqoyeE2o/_generated/favicon/browserconfig.xml\">\u003cmeta data-mint-head name=\"apple-mobile-web-app-title\" content=\"Replit\">\u003cmeta data-mint-head name=\"msapplication-TileColor\" content=\"#FF3C00\">\u003cmeta data-mint-head name=\"twitter:creator\" content=\"@replit\">\u003cmeta data-mint-head name=\"author\" content=\"Replit\">\u003clink data-mint-head rel=\"canonical\" href=\"https://docs.replit.com/features/publishing/performance-agent\">\u003clink data-mint-head rel=\"alternate\" type=\"application/xml\" href=\"/sitemap.xml\">\u003clink data-mint-head rel=\"alternate\" type=\"text/markdown\" href=\"/features/publishing/performance-agent.md\">\u003cscript data-mint-head type=\"application/ld+json\">{\"@context\":\"https://schema.org\",\"@graph\":[{\"@type\":\"Organization\",\"@id\":\"https://docs.replit.com/#organization\",\"name\":\"Replit\",\"url\":\"https://docs.replit.com\",\"logo\":{\"@type\":\"ImageObject\",\"url\":\"https://mintcdn.com/replit/j4of5To8jzehz0JK/logo/light.svg?fit=max\u0026auto=format\u0026n=j4of5To8jzehz0JK\u0026q=85\u0026s=6209cb5927b56fd1781133af05428373\"}},{\"@type\":\"WebSite\",\"@id\":\"https://docs.replit.com#website\",\"name\":\"Replit\",\"url\":\"https://docs.replit.com\",\"publisher\":{\"@id\":\"https://docs.replit.com/#organization\"}},{\"@type\":\"WebPage\",\"@id\":\"https://docs.replit.com/features/publishing/performance-agent#webpage\",\"url\":\"https://docs.replit.com/features/publishing/performance-agent\",\"name\":\"Performance Agent\",\"description\":\"Scan your app for slow requests and database bottlenecks with Performance Agent, then fix the issues with Agent and republish.\",\"dateModified\":\"2026-11-09T17:46:33.023Z\",\"isPartOf\":{\"@id\":\"https://docs.replit.com#website\"},\"breadcrumb\":{\"@id\":\"https://docs.replit.com/features/publishing/performance-agent#breadcrumb\"}},{\"@type\":\"BreadcrumbList\",\"@id\":\"https://docs.replit.com/features/publishing/performance-agent#breadcrumb\",\"itemListElement\":[{\"@type\":\"ListItem\",\"position\":1,\"name\":\"Monitoring\",\"item\":\"https://docs.replit.com/features/publishing/monitoring-a-deployment\"},{\"@type\":\"ListItem\",\"position\":2,\"name\":\"Performance Agent\",\"item\":\"https://docs.replit.com/features/publishing/performance-agent\"}]},{\"@type\":[\"Article\",\"TechArticle\"],\"@id\":\"https://docs.replit.com/features/publishing/performance-agent#article\",\"headline\":\"Performance Agent\",\"name\":\"Performance Agent\",\"description\":\"Scan your app for slow requests and database bottlenecks with Performance Agent, then fix the issues with Agent and republish.\",\"url\":\"https://docs.replit.com/features/publishing/performance-agent\",\"mainEntityOfPage\":{\"@id\":\"https://docs.replit.com/features/publishing/performance-agent#webpage\"},\"dateModified\":\"2026-11-09T17:46:33.023Z\",\"publisher\":{\"@id\":\"https://docs.replit.com/#organization\"},\"isPartOf\":{\"@id\":\"https://docs.replit.com#website\"}}]}\u003c/script>","siteName":"Replit","nav":{"global":null,"languages":[{"language":"en","tabs":[{"tab":"Home","pages":[{"title":"Home","href":"/welcome"}]},{"tab":"Chats","pages":[{"title":"Chats","href":"/chat/overview"}]},{"tab":"Apps","dropdowns":[{"dropdown":"Web","icon":"globe","pages":[{"group":"Quickstarts","pages":[{"title":"Build your first app","sidebarTitle":"Build your first app","icon":"rocket","href":"/build/your-first-app"},{"title":"Build and publish from a template","sidebarTitle":"Build from a template","icon":"palette","href":"/build/build-and-publish-from-template"},{"title":"Build with Free Mode","sidebarTitle":"Build with Free Mode","icon":"seedling","href":"/build/build-with-free-mode"},{"title":"Publish your app","sidebarTitle":"Publish your app","icon":"cloud-arrow-up","href":"/build/publish-your-app"}]},{"group":"Build paths","pages":[{"title":"Prototype a product idea","sidebarTitle":"Prototype an idea","icon":"lightbulb","href":"/build/prototype-an-idea"},{"title":"Launch a landing page","sidebarTitle":"Launch a landing page","icon":"rectangle-list","href":"/build/landing-page"},{"title":"Build a Shopify storefront","sidebarTitle":"Build a Shopify storefront","icon":"bag-shopping","href":"/build/ecommerce-store"},{"title":"Create a dashboard from data","sidebarTitle":"Create a dashboard","icon":"chart-simple","href":"/build/dashboard"},{"title":"Build a mobile app","sidebarTitle":"Build a mobile app","icon":"mobile-screen","href":"/build/mobile-app"}]},{"group":"Grow your app","pages":[{"title":"Add login","sidebarTitle":"Add login","icon":"user-lock","href":"/build/add-login"},{"title":"Add a database","sidebarTitle":"Add a database","icon":"database","href":"/build/add-database"},{"title":"Add integrations","sidebarTitle":"Add integrations","icon":"plug","href":"/build/add-integrations"},{"title":"Add a custom domain","sidebarTitle":"Add a custom domain","icon":"globe","href":"/build/add-custom-domain"}]},{"group":"Publish and operate","pages":[{"title":"Purchase a domain","sidebarTitle":"Purchase a domain","icon":"cart-shopping","href":"/build/domain-purchasing"},{"title":"Enable Feedback Widget","sidebarTitle":"Enable Feedback Widget","icon":"comment","href":"/build/enable-feedback"},{"title":"Improve your app's SEO","sidebarTitle":"Improve SEO","icon":"magnifying-glass-chart","href":"/build/improve-seo"},{"title":"Troubleshoot publishing","icon":"triangle-exclamation","href":"/build/troubleshooting"}]},{"group":"Connect \u0026 integrate","pages":[{"title":"Use Agent Skills","sidebarTitle":"Use Agent Skills","icon":"puzzle-piece","href":"/build/use-agent-skills"},{"title":"Connect via MCP","sidebarTitle":"Connect via MCP","icon":"server","href":"/build/connect-via-mcp"}]},{"group":"Collaborate","pages":[{"title":"Invite teammates","sidebarTitle":"Invite teammates","icon":"user-plus","href":"/build/invite-teammates"},{"title":"Create a team workspace","sidebarTitle":"Create a team workspace","icon":"users-rectangle","href":"/build/create-a-team-workspace"}]},{"group":"Import","pages":[{"title":"Import from a provider","sidebarTitle":"Import from a provider","icon":"file-import","href":"/build/import-from-providers"}]}]},{"dropdown":"Mobile","icon":"mobile","groups":[{"group":"Quickstarts","pages":[{"title":"Start your first mobile app","sidebarTitle":"Start your mobile app","icon":"wand-magic-sparkles","href":"/build/mobile-first-app"},{"title":"Preview and test on your phone","sidebarTitle":"Test with Expo Go","icon":"mobile","href":"/build/mobile-preview-testing"}]},{"group":"Publish for iOS","pages":[{"title":"Set up your Apple Developer account","sidebarTitle":"Set up your account","icon":"apple","href":"/build/mobile-apple-account"},{"title":"Upload your app to App Store Connect","sidebarTitle":"Upload your app","icon":"cloud-arrow-up","href":"/build/mobile-upload-ios"},{"title":"Beta test with TestFlight","sidebarTitle":"Test on TestFlight","icon":"flask","href":"/build/mobile-testflight"},{"title":"Submit to the App Store","sidebarTitle":"Submit for App Store","icon":"paper-plane","href":"/build/mobile-publish-ios"}]},{"group":"Add features and grow your app","pages":[{"title":"Add login","sidebarTitle":"Add login","icon":"right-to-bracket","href":"/build/mobile-login"},{"title":"Add payments with RevenueCat","sidebarTitle":"Add payments","icon":"credit-card","href":"/build/mobile-payments"},{"title":"Store images in your mobile app","sidebarTitle":"Save player images","icon":"image","href":"/build/mobile-store-images"},{"title":"Add haptics","sidebarTitle":"Add haptics","icon":"wave-square","href":"/build/mobile-haptics"},{"title":"Use iOS native components","sidebarTitle":"Use native UI","icon":"apple","href":"/build/mobile-native-components"},{"title":"Use the camera","sidebarTitle":"Add camera","icon":"camera","href":"/build/mobile-camera"},{"title":"Access contacts","sidebarTitle":"Add contacts","icon":"address-book","href":"/build/mobile-contacts"},{"title":"Send push notifications","sidebarTitle":"Send notifications","icon":"bell","href":"/build/mobile-push-notifications"},{"title":"Collect reviews and ratings","sidebarTitle":"Collect reviews","icon":"star","href":"/build/mobile-collect-reviews"}]},{"group":"Design","pages":[{"title":"Design your app","sidebarTitle":"Design your app","icon":"palette","href":"/build/mobile-design"},{"title":"Generate an app icon","sidebarTitle":"Generate app icon","icon":"image","href":"/build/mobile-app-icon"},{"title":"Generate App Store screenshots","sidebarTitle":"Generate store assets","icon":"images","href":"/build/mobile-store-screenshots"}]},{"group":"Collaborate","pages":[{"title":"Build PixelGames with a team","sidebarTitle":"Invite your team","icon":"users","href":"/build/mobile-invite-team"}]}]}]},{"tab":"Code","pages":[{"title":"Code","href":"/build/code/code-with-replit"}]},{"tab":"Designs","pages":[{"title":"Designs","href":"/design/what-is-replit-design"}]},{"tab":"Use cases","pages":[{"title":"Use cases","href":"/use-cases"}]},{"tab":"Learn","pages":[{"title":"Learn","href":"/learn/foundations/what-is-an-app"}]},{"tab":"Features","anchors":[{"anchor":"Features","icon":"book-open","groups":[{"group":"Workspace \u0026 Admin","pages":[{"title":"Workspaces","sidebarTitle":"Workspaces","icon":"building","href":"/features/collaboration/workspaces"},{"title":"Personal \u0026 Team Workspaces","sidebarTitle":"Personal \u0026 Team Workspaces","icon":"users","href":"/features/collaboration/team-workspaces"},{"title":"Workspace geography","sidebarTitle":"Workspace geography","icon":"globe","href":"/features/collaboration/workspace-geography"},{"title":"Workspace Settings","sidebarTitle":"Workspace Settings","icon":"sliders","href":"/features/collaboration/workspace-settings"},{"title":"Enterprise model controls","sidebarTitle":"Model controls","icon":"microchip","href":"/features/collaboration/enterprise-model-controls"},{"title":"Admin API","sidebarTitle":"Admin API","icon":"key","href":"/teams/admin-api"}]},{"group":"Chats and routines","pages":[{"title":"Chats","sidebarTitle":"Chats","icon":"comments","href":"/features/chats-and-routines/chats"},{"title":"Routines","sidebarTitle":"Routines","icon":"arrows-rotate","href":"/features/chats-and-routines/routines"},{"title":"Sharing chats and assets","sidebarTitle":"Sharing chats and assets","icon":"share-nodes","href":"/features/chats-and-routines/sharing"}]},{"group":"Projects \u0026 artifacts","pages":[{"title":"What's a Project?","sidebarTitle":"Projects","icon":"diagram-project","href":"/features/projects-and-artifacts/projects"},{"title":"What's an Artifact?","sidebarTitle":"Artifacts","icon":"layer-group","href":"/features/projects-and-artifacts/artifacts"},{"title":"Multiple Artifacts vs. Separate Projects","sidebarTitle":"Artifacts vs. Projects","icon":"code-compare","href":"/features/projects-and-artifacts/multiple-artifacts-vs-projects"},{"title":"Updating older projects for multiple artifact support","sidebarTitle":"Update older projects","icon":"rotate","href":"/features/projects-and-artifacts/updating-projects-for-multiple-artifacts"},{"title":"Remix an app","sidebarTitle":"Remixing","icon":"clone","href":"/features/projects-and-artifacts/remix-an-app"}]},{"group":"Project editor","pages":[{"title":"Editor \u0026 Tools","sidebarTitle":"Tools","icon":"toolbox","href":"/features/editor/editor-and-tools"},{"title":"Preview","icon":"eye","href":"/features/editor/preview"},{"title":"Keyboard Shortcuts","icon":"keyboard","href":"/features/editor/keyboard-shortcuts"},{"title":"User Settings","icon":"user-gear","href":"/features/editor/user-settings"}]},{"group":"Agent","pages":[{"title":"Replit Agent","sidebarTitle":"Replit Agent","icon":"robot","href":"/features/agent/overview"},{"title":"Plan Mode","sidebarTitle":"Plan Mode","icon":"clipboard-list","href":"/features/agent/plan-mode"},{"title":"Agent Modes","sidebarTitle":"Agent Modes","icon":"bolt","href":"/features/agent/agent-modes"},{"title":"Model selector","sidebarTitle":"Model selector","icon":"microchip","href":"/features/agent/model-selector"},{"title":"App Testing","sidebarTitle":"App Testing","icon":"vial","href":"/features/agent/app-testing"},{"title":"General Agent","sidebarTitle":"General Agent","icon":"compass","href":"/features/agent/general-agent"}]},{"group":"Publishing","pages":[{"title":"Publishing","sidebarTitle":"Overview","icon":"cloud-arrow-up","href":"/features/publishing/overview"},{"title":"After you publish","sidebarTitle":"After you publish","icon":"rocket","href":"/features/publishing/after-you-publish"},{"title":"Custom Domains","icon":"at","href":"/features/publishing/custom-domains"},{"title":"Who can access your app","sidebarTitle":"Access","icon":"user-shield","href":"/features/publishing/private-deployments"},{"title":"Feedback widget","sidebarTitle":"Feedback widget","icon":"comment-dots","href":"/features/publishing/feedback-widget"},{"title":"Deployment types","sidebarTitle":"Deployment types","icon":"server","href":"/features/publishing/deployment-types"},{"title":"Machine configuration","sidebarTitle":"Machines","icon":"microchip","href":"/features/publishing/machine-configuration"},{"title":"Project geography","sidebarTitle":"Project geography","icon":"globe","href":"/features/publishing/project-geography"}]},{"group":"Monitoring","pages":[{"title":"Monitoring your app","sidebarTitle":"Monitor your app","icon":"chart-line","href":"/features/publishing/monitoring-a-deployment"},{"title":"Monitoring Agent","sidebarTitle":"Monitoring Agent","description":"Use Monitoring Agent to investigate production alerts, attempt fixes, and automatically republish them. Ask Agent about your published app's logs and metrics.","icon":"robot","href":"/features/publishing/monitoring-agent"},{"title":"Performance Agent","sidebarTitle":"Performance Agent","icon":"gauge-high","href":"/features/publishing/performance-agent"}]},{"group":"Database","pages":[{"title":"Database","sidebarTitle":"Overview","description":"Learn how to use Replit's built-in SQL database to store and retrieve data for your app.","icon":"table","href":"/features/data-and-storage/sql-database"},{"title":"Development and production databases","sidebarTitle":"Development and production","icon":"server","href":"/features/data-and-storage/development-and-production"},{"title":"How Publish updates your production database","sidebarTitle":"Publish database changes","icon":"database","href":"/features/data-and-storage/publish-database-changes"},{"title":"Work with your data","sidebarTitle":"Work with your data","icon":"table-cells","href":"/features/data-and-storage/work-with-your-data"},{"title":"Monitor your database","sidebarTitle":"Monitoring","icon":"chart-line","href":"/features/data-and-storage/monitor-your-database"},{"title":"Connection details","sidebarTitle":"Connection details","icon":"plug","href":"/features/data-and-storage/connection-details"},{"title":"Data recovery","sidebarTitle":"Data recovery","icon":"clock-rotate-left","href":"/features/data-and-storage/data-recovery"}]},{"group":"Users \u0026 Auth","pages":[{"title":"Users \u0026 Auth","sidebarTitle":"Overview","icon":"users","href":"/features/auth-and-identity/overview"},{"title":"Replit Auth","sidebarTitle":"Replit Auth","icon":"lock","href":"/features/auth-and-identity/authentication"},{"title":"Clerk Auth","sidebarTitle":"Clerk Auth","icon":"user-lock","href":"/features/auth-and-identity/clerk-auth"},{"title":"Add SSO to your app (Clerk)","sidebarTitle":"Add SSO to your app","icon":"key","href":"/features/auth-and-identity/single-sign-on"},{"title":"Migrate from Replit Auth to Clerk","sidebarTitle":"Migrate to Clerk","icon":"right-left","href":"/features/auth-and-identity/migrate-auth-to-clerk"},{"title":"Sign-in providers","sidebarTitle":"Sign-in providers","icon":"right-to-bracket","href":"/features/auth-and-identity/sign-in-providers"},{"title":"Plan a custom auth migration","sidebarTitle":"Custom auth migration","icon":"right-left","href":"/features/auth-and-identity/custom-auth-migration"}]},{"group":"Security Center","pages":[{"title":"Project Security Center","sidebarTitle":"Project Security Center","icon":"shield-virus","href":"/features/security/project-security-center"},{"title":"Security scan levels","sidebarTitle":"Security scan levels","icon":"layer-group","href":"/features/security/security-scan-levels"},{"title":"Agent security scans","sidebarTitle":"Agent security scans","icon":"shield-check","href":"/features/security/agent-security-scans"},{"title":"Black-box pen tests","sidebarTitle":"Black-box pen tests","icon":"user-secret","href":"/features/security/black-box-pen-tests"},{"title":"Workspace Security Center","sidebarTitle":"Workspace Security Center","icon":"users-rectangle","href":"/features/security/workspace-security-center"},{"title":"Package Firewall","sidebarTitle":"Package Firewall","icon":"shield-check","href":"/features/security/package-firewall"},{"title":"Set up Tunnels","sidebarTitle":"Tunnels","icon":"network-wired","href":"/features/security/tunnels"},{"title":"Security","sidebarTitle":"Security","icon":"shield-halved","href":"/features/security/overview"},{"title":"Geography","sidebarTitle":"Geography","icon":"globe","href":"/features/security/geography"},{"title":"Security concepts","sidebarTitle":"Concepts","icon":"book","href":"/features/security/concepts"},{"title":"Replit shared responsibility model","sidebarTitle":"Shared responsibility model","icon":"scale-balanced","href":"/features/security/shared-responsibility-model"}]},{"group":"App Storage","pages":[{"title":"App Storage","sidebarTitle":"Overview","icon":"box-archive","href":"/features/data-and-storage/object-storage"},{"title":"App Storage Python SDK","icon":"python","href":"/features/sdks/object-storage-python-sdk"},{"title":"App Storage JavaScript SDK","icon":"js","href":"/features/sdks/object-storage-javascript-sdk"}]},{"group":"Growth","pages":[{"title":"Project Analytics","sidebarTitle":"Project Analytics","icon":"chart-line-up","href":"/features/publishing/project-analytics"},{"title":"SEO Rating","sidebarTitle":"SEO Rating","icon":"magnifying-glass-chart","href":"/features/publishing/seo-rating"},{"title":"SEO Agent","sidebarTitle":"SEO Agent","icon":"robot","href":"/features/publishing/seo-agent"}]},{"group":"Integrations","pages":[{"title":"Agent Integrations","sidebarTitle":"Connectors","icon":"plug","href":"/features/integrations/overview"},{"title":"Custom connectors","sidebarTitle":"Custom connectors","icon":"plug","href":"/features/integrations/custom-connectors"},{"title":"Replit AI Integrations","sidebarTitle":"AI","icon":"sparkles","href":"/features/integrations/replit-ai-integrations"},{"title":"Connect Plaid","sidebarTitle":"Plaid","icon":"building-columns","href":"/features/integrations/plaid-connector"},{"title":"Connect Shopify","sidebarTitle":"Shopify","icon":"bag-shopping","href":"/features/integrations/shopify"},{"title":"Open in Replit","sidebarTitle":"Open in Replit","icon":"arrow-up-right-from-square","href":"/features/integrations/open-in-replit"}]},{"group":"MCP \u0026 API","pages":[{"title":"MCP list","sidebarTitle":"MCP list","icon":"server","href":"/features/mcp/overview"},{"title":"Replit MCP Server","sidebarTitle":"Replit MCP server","icon":"server","href":"/platforms/mcp-server"}]},{"group":"Git","pages":[{"title":"Using the Git pane","icon":"code-fork","href":"/features/workspace-tools/git-interface"},{"title":"Checkpoints and Rollbacks","sidebarTitle":"Checkpoints","icon":"bookmark","href":"/features/version-control/checkpoints-and-rollbacks"},{"title":"File History","icon":"clock-rotate-left","href":"/features/version-control/file-history"},{"title":"Git disaster recovery","sidebarTitle":"Disaster Recovery","icon":"life-ring","href":"/features/version-control/disaster-recovery"}]},{"group":"Secrets","pages":[{"title":"Secrets","icon":"key","href":"/core-concepts/project-editor/app-setup/secrets"}]},{"group":"Agent Skills","pages":[{"title":"Agent Skills","sidebarTitle":"Agent Skills","icon":"puzzle-piece","href":"/features/agent/skills"},{"title":"Agent Customization","sidebarTitle":"Agent Customization","icon":"sliders","href":"/features/agent/agent-customization"},{"title":"Skills directory","sidebarTitle":"Skills directory","icon":"grid","href":"/features/agent/skills-directory"}]},{"group":"Workspace tools","pages":[{"title":"Shell","icon":"square-terminal","href":"/features/workspace-tools/shell"},{"title":"Console","icon":"terminal","href":"/features/workspace-tools/console"},{"title":"SSH","icon":"network-wired","href":"/features/workspace-tools/ssh"},{"title":"Workflows","icon":"play","href":"/features/workspace-tools/workflows"},{"title":"The Graphical Command Line Interface","sidebarTitle":"CLUI","icon":"command","href":"/features/workspace-tools/clui-graphical-cli"}]},{"group":"Agent capabilities","pages":[{"title":"Charts","sidebarTitle":"Charts","icon":"chart-line","href":"/features/agent/charts"},{"title":"Image Generation","sidebarTitle":"Image Generation","icon":"image","href":"/features/agent/image-generation"},{"title":"Audio Generation","sidebarTitle":"Audio Generation","icon":"music","href":"/features/agent/audio-generation"},{"title":"Voice Mode","sidebarTitle":"Voice Mode","icon":"microphone","href":"/features/agent/voice-mode"},{"title":"Steer or queue follow-up messages","sidebarTitle":"Steer or queue messages","icon":"comments","href":"/features/agent/steer-and-queue-messages"},{"title":"Web Search","icon":"magnifying-glass","href":"/features/agent/web-search"}]},{"group":"Tasks","pages":[{"title":"Task lifecycle","sidebarTitle":"Task lifecycle","icon":"arrows-spin","href":"/features/agent/task-lifecycle"},{"title":"Task board","sidebarTitle":"Task board","icon":"table-columns","href":"/features/agent/task-board"},{"title":"Follow-up tasks","sidebarTitle":"Follow-up tasks","icon":"arrow-turn-right","href":"/features/agent/follow-up-tasks"}]},{"group":"Artifact types","pages":[{"title":"Web Apps","sidebarTitle":"Web Apps","icon":"globe","href":"/features/artifact-types/web-apps"},{"title":"Native Mobile Apps","icon":"mobile-screen","href":"/features/artifact-types/building-mobile-apps"},{"title":"Data Visualization","sidebarTitle":"Data Visualization","icon":"chart-column","href":"/features/artifact-types/data-apps"},{"title":"Slide Decks","sidebarTitle":"Slide Decks","icon":"presentation-screen","href":"/features/artifact-types/slide-decks"},{"title":"Animated Videos","sidebarTitle":"Animated Videos","icon":"film","href":"/features/artifact-types/animated-videos"}]},{"group":"Monetization","pages":[{"title":"Monetization","sidebarTitle":"Overview","icon":"sack-dollar","href":"/features/monetization/overview"},{"title":"Whop Payments Integration","sidebarTitle":"Whop Payments","icon":"store","href":"/features/monetization/whop-payments"},{"title":"Stripe Payments Integration","sidebarTitle":"Stripe Payments","icon":"credit-card","href":"/features/monetization/stripe-payments"},{"title":"RevenueCat Subscriptions","sidebarTitle":"RevenueCat","icon":"repeat","href":"/features/monetization/revenuecat-subscriptions"}]},{"group":"Project setup","pages":[{"title":"Replit App Configuration","sidebarTitle":"Advanced Configuration","icon":"gear","href":"/features/project-setup/configuration"},{"title":"replit.md","icon":"file-lines","href":"/features/project-setup/replit-dot-md"},{"title":"Dependency Management","sidebarTitle":"Dependencies","icon":"boxes-packing","href":"/features/project-setup/dependency-management"},{"title":"Ports","icon":"plug","href":"/features/project-setup/ports"},{"title":"Developer Frameworks","icon":"cubes","href":"/features/project-setup/developer-frameworks"}]},{"group":"Platforms","pages":[{"title":"Replit in ChatGPT","sidebarTitle":"ChatGPT","icon":"comments","href":"/features/platforms/chatgpt"},{"title":"Replit in Claude","sidebarTitle":"Claude","icon":"plug","href":"/features/platforms/claude"},{"title":"Replit on Slack","sidebarTitle":"Slack","icon":"slack","href":"/features/platforms/slack"},{"title":"Replit Mobile App","sidebarTitle":"Mobile App","icon":"mobile-screen-button","href":"/features/platforms/mobile-app"},{"title":"Replit Desktop App","sidebarTitle":"Desktop App","icon":"desktop","href":"/features/platforms/desktop-app"}]},{"group":"Troubleshooting","pages":[{"title":"Mobile app troubleshooting","sidebarTitle":"Mobile app","icon":"mobile-screen","href":"/features/troubleshooting/mobile-app"}]},{"group":"Additional Resources","pages":[{"title":"FAQ","icon":"circle-question","href":"/features/additional-resources/faq"},{"title":"Replit Cheat Sheet","sidebarTitle":"Cheat Sheet","icon":"book-open","href":"/features/additional-resources/cheat-sheet"},{"title":"Static Deployment Configuration","sidebarTitle":"Advanced static","icon":"sliders","href":"/features/deployment-customization/static-deployments-advanced"},{"title":"External Access Tokens","sidebarTitle":"Access tokens","icon":"id-badge","href":"/features/deployment-customization/external-access-tokens"},{"title":"Fix a published app using a shared database","sidebarTitle":"Migrate shared data","icon":"arrow-right-arrow-left","href":"/features/data-and-storage/shared-database-migration"}]}]},{"anchor":"Changelog","icon":"clock-rotate-left","pages":[{"title":"Changelog","href":"/updates/2026/11/06/changelog"}]},{"anchor":"Help","icon":"circle-question","pages":[{"title":"Help","href":"/help/overview"}]}]},{"tab":"Trust \u0026 Billing","pages":[{"title":"Trust \u0026 Billing","href":"/category/billing"}]},{"tab":"Enterprise","pages":[{"title":"Enterprise","href":"/teams/welcome"}]}]},{"language":"fr","navbar":{"links":[],"primary":{"type":"button","label":"Commencer à créer","href":"https://replit.com?ref=docs"}},"pages":[{"title":"fr","href":"/fr/welcome"}]},{"language":"pt","navbar":{"links":[],"primary":{"type":"button","label":"Comece a criar","href":"https://replit.com?ref=docs"}},"hidden":false,"pages":[{"title":"pt","href":"/pt/welcome"}]},{"language":"ja","navbar":{"links":[],"primary":{"type":"button","label":"作成を開始","href":"https://replit.com?ref=docs"}},"hidden":false,"pages":[{"title":"ja","href":"/ja/welcome"}]},{"language":"ko","navbar":{"links":[],"primary":{"type":"button","label":"빌드 시작하기","href":"https://replit.com?ref=docs"}},"hidden":false,"pages":[{"title":"ko","href":"/ko/welcome"}]}]},"basePath":"","title":"Performance Agent - Replit","buildId":"dpl_42LwxxU1kGN114H4XzwGYXa9ZDah","deploymentId":"dpl_42LwxxU1kGN114H4XzwGYXa9ZDah","dynamics":["07c022d89b","a74be98ba7"],"chunks":["Frame-5Xwp92K7.js","DynamicMarkdown-BoyYAA8K.js","zoom-image-lightbox-DkE6VzSN.js","lightbox-handle-r17bVUz3.js"]}