

Monitoring is available for production databases only.
How to access Monitoring
How to access Monitoring
From the Database tool:
- Select your production database.
- Select the Monitoring tab.
- Choose Active queries or Query performance.
Active queries
A live snapshot of everything running against your database right now: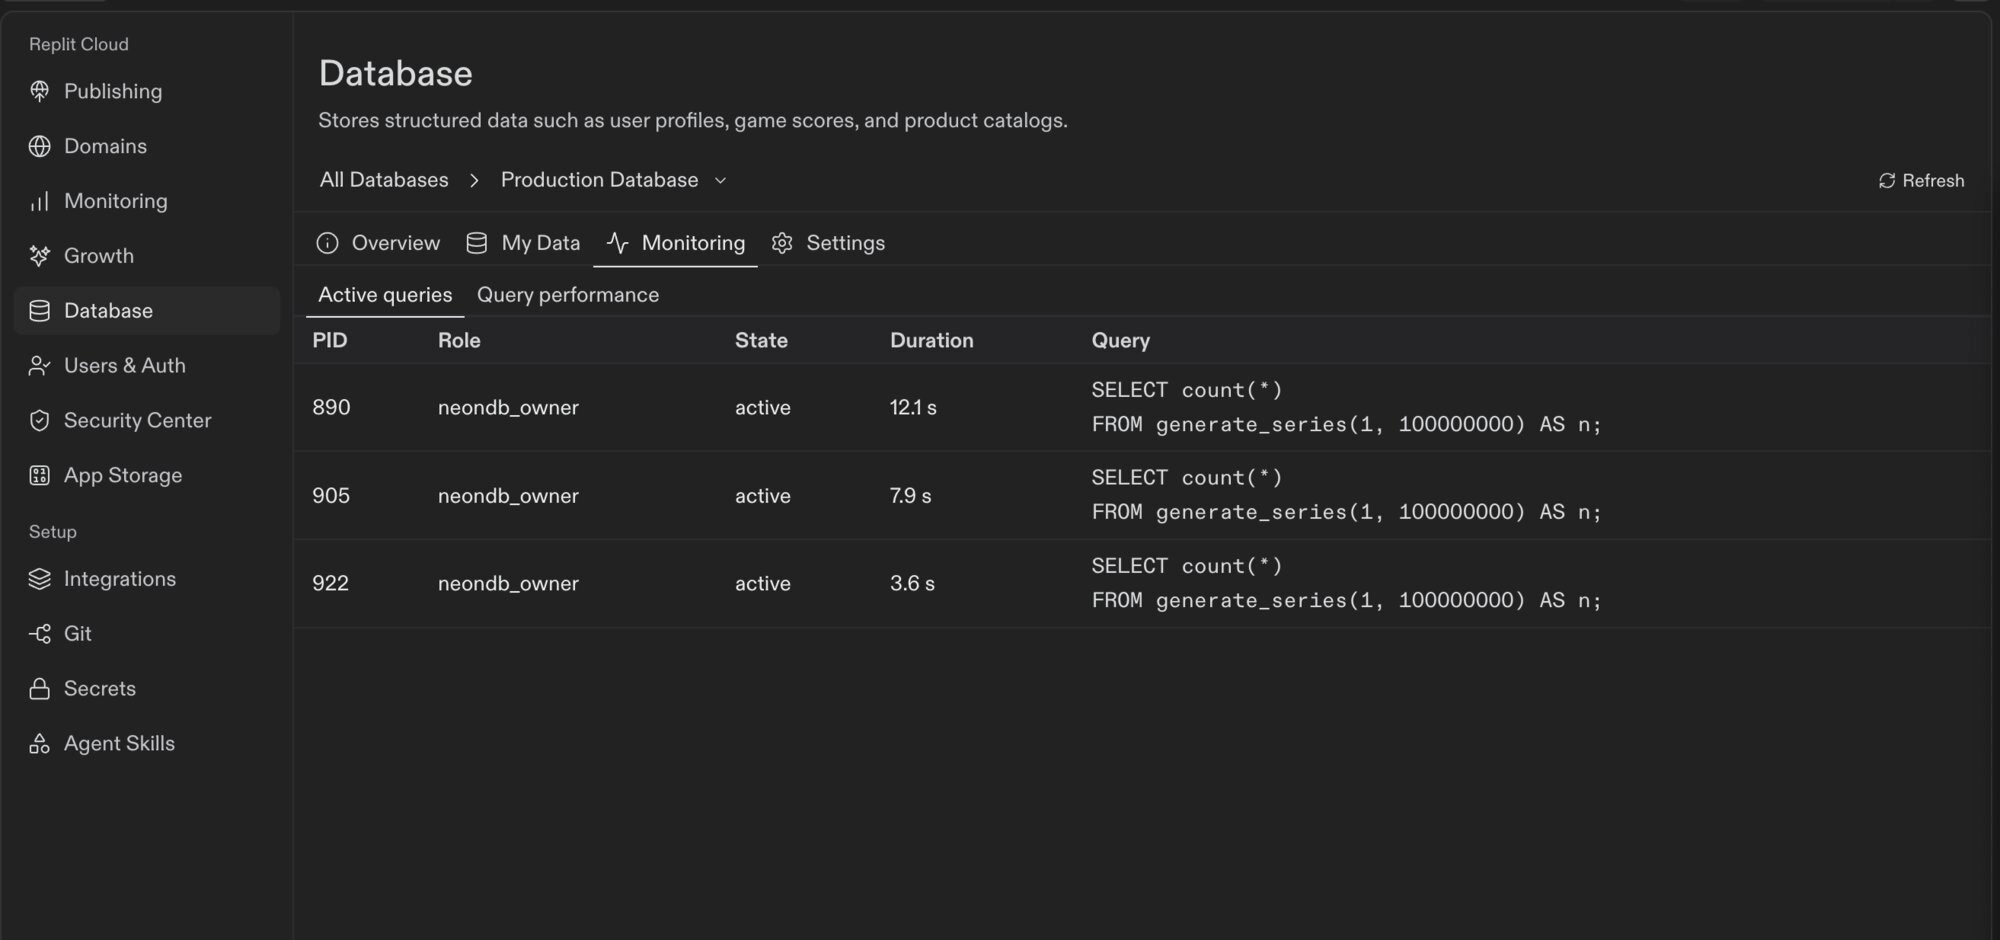
- PID: The process ID of the connection running the query.
- Role: The database user that opened the connection.
- State:
activemeans a query is running.idle in transactionmeans a transaction is open but doing nothing. It still holds locks. - Duration: How long the current query has been running.
- Query: The statement itself.
Query performance
Statistics for every query your database has run, with the most expensive first: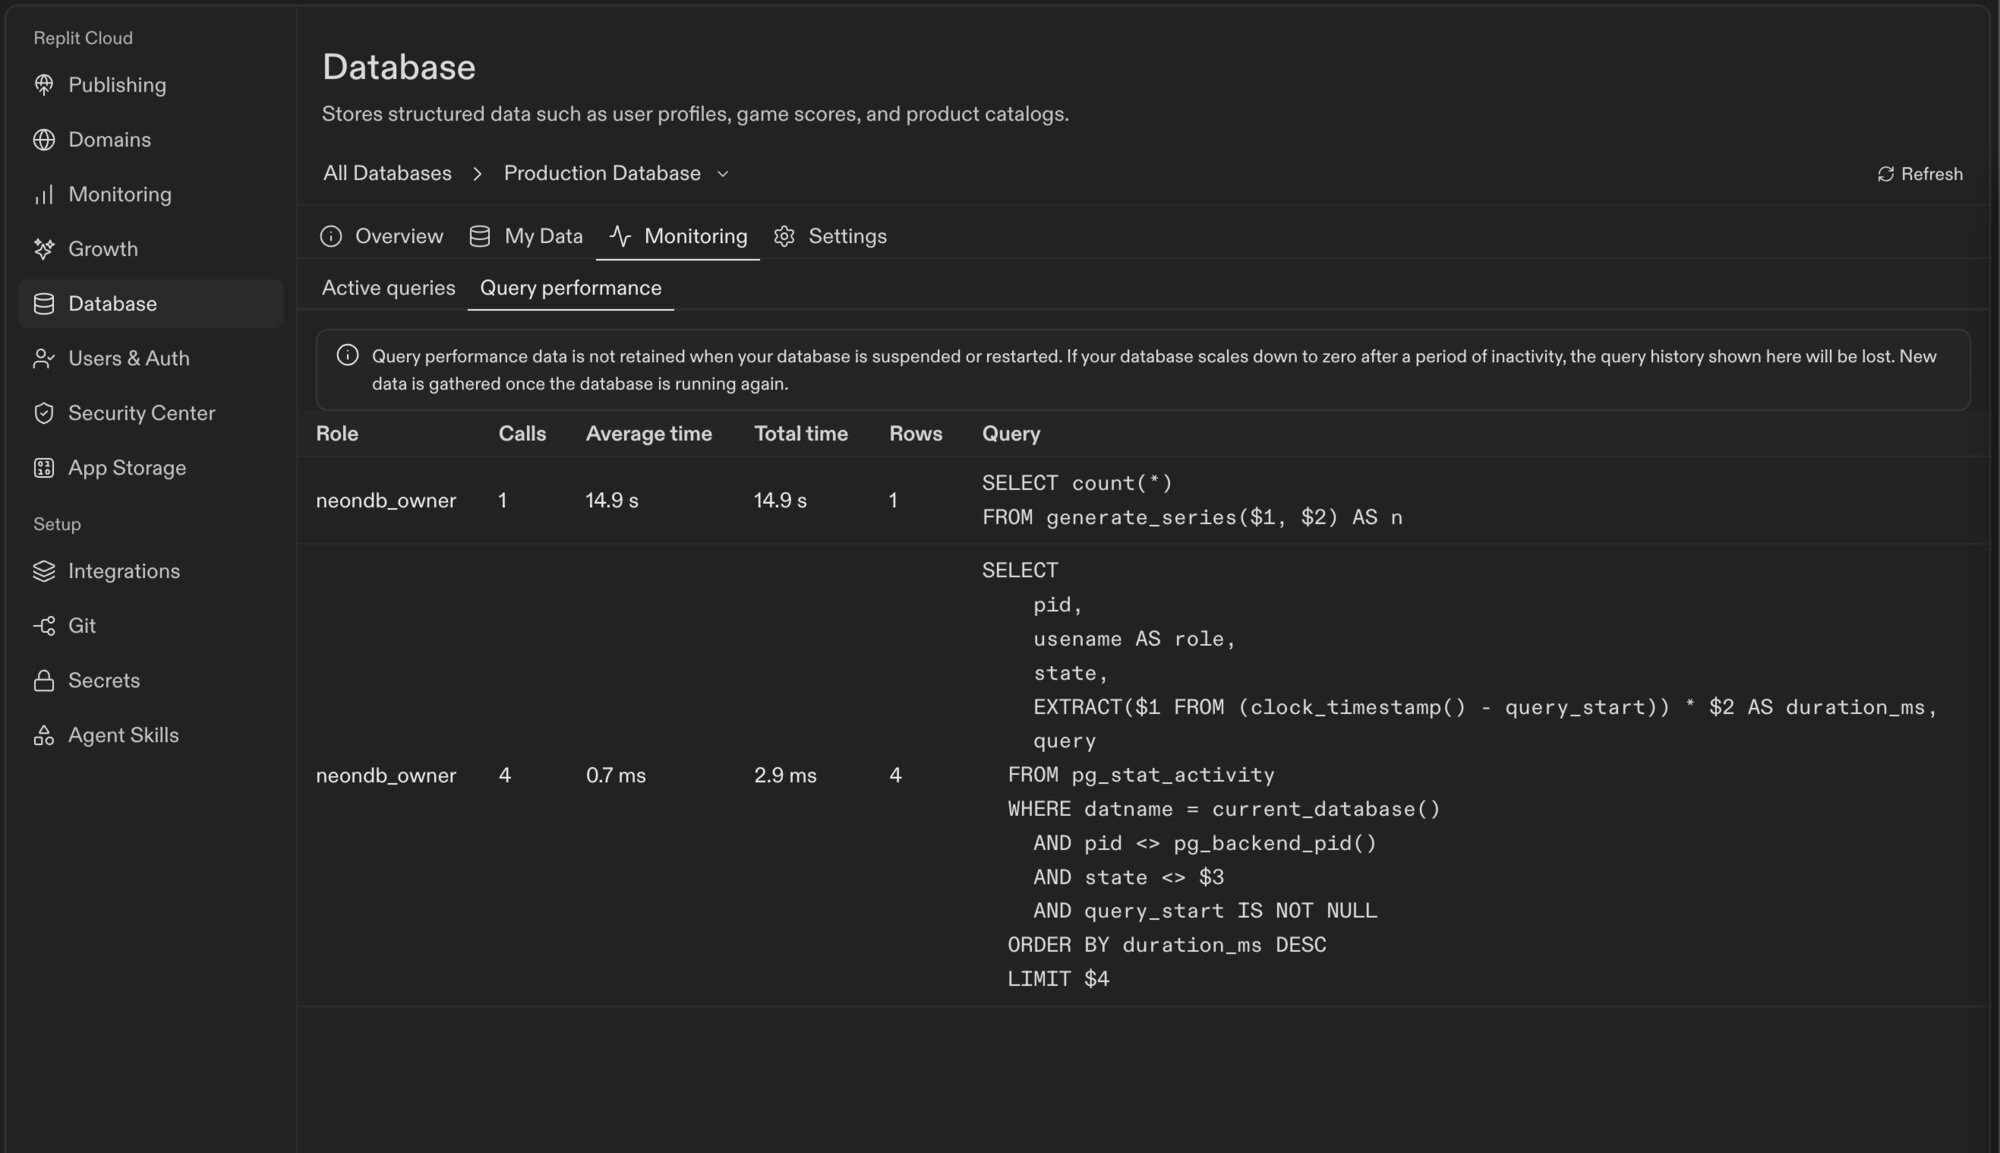
- Calls: How many times the query has run.
- Average time: The mean time per run. Individual runs aren’t shown, only the average.
- Total time: Average time multiplied by calls. The table sorts on this.
- Rows: Total rows across all calls, not per call.
- Query: The statement, with your values replaced by placeholders such as
$1.
Next steps
- Work with your data: Browse, edit, and query your data.
- Data recovery: Restore production data.