The Analytics Dashboard is available exclusively for Enterprise customers.
Features
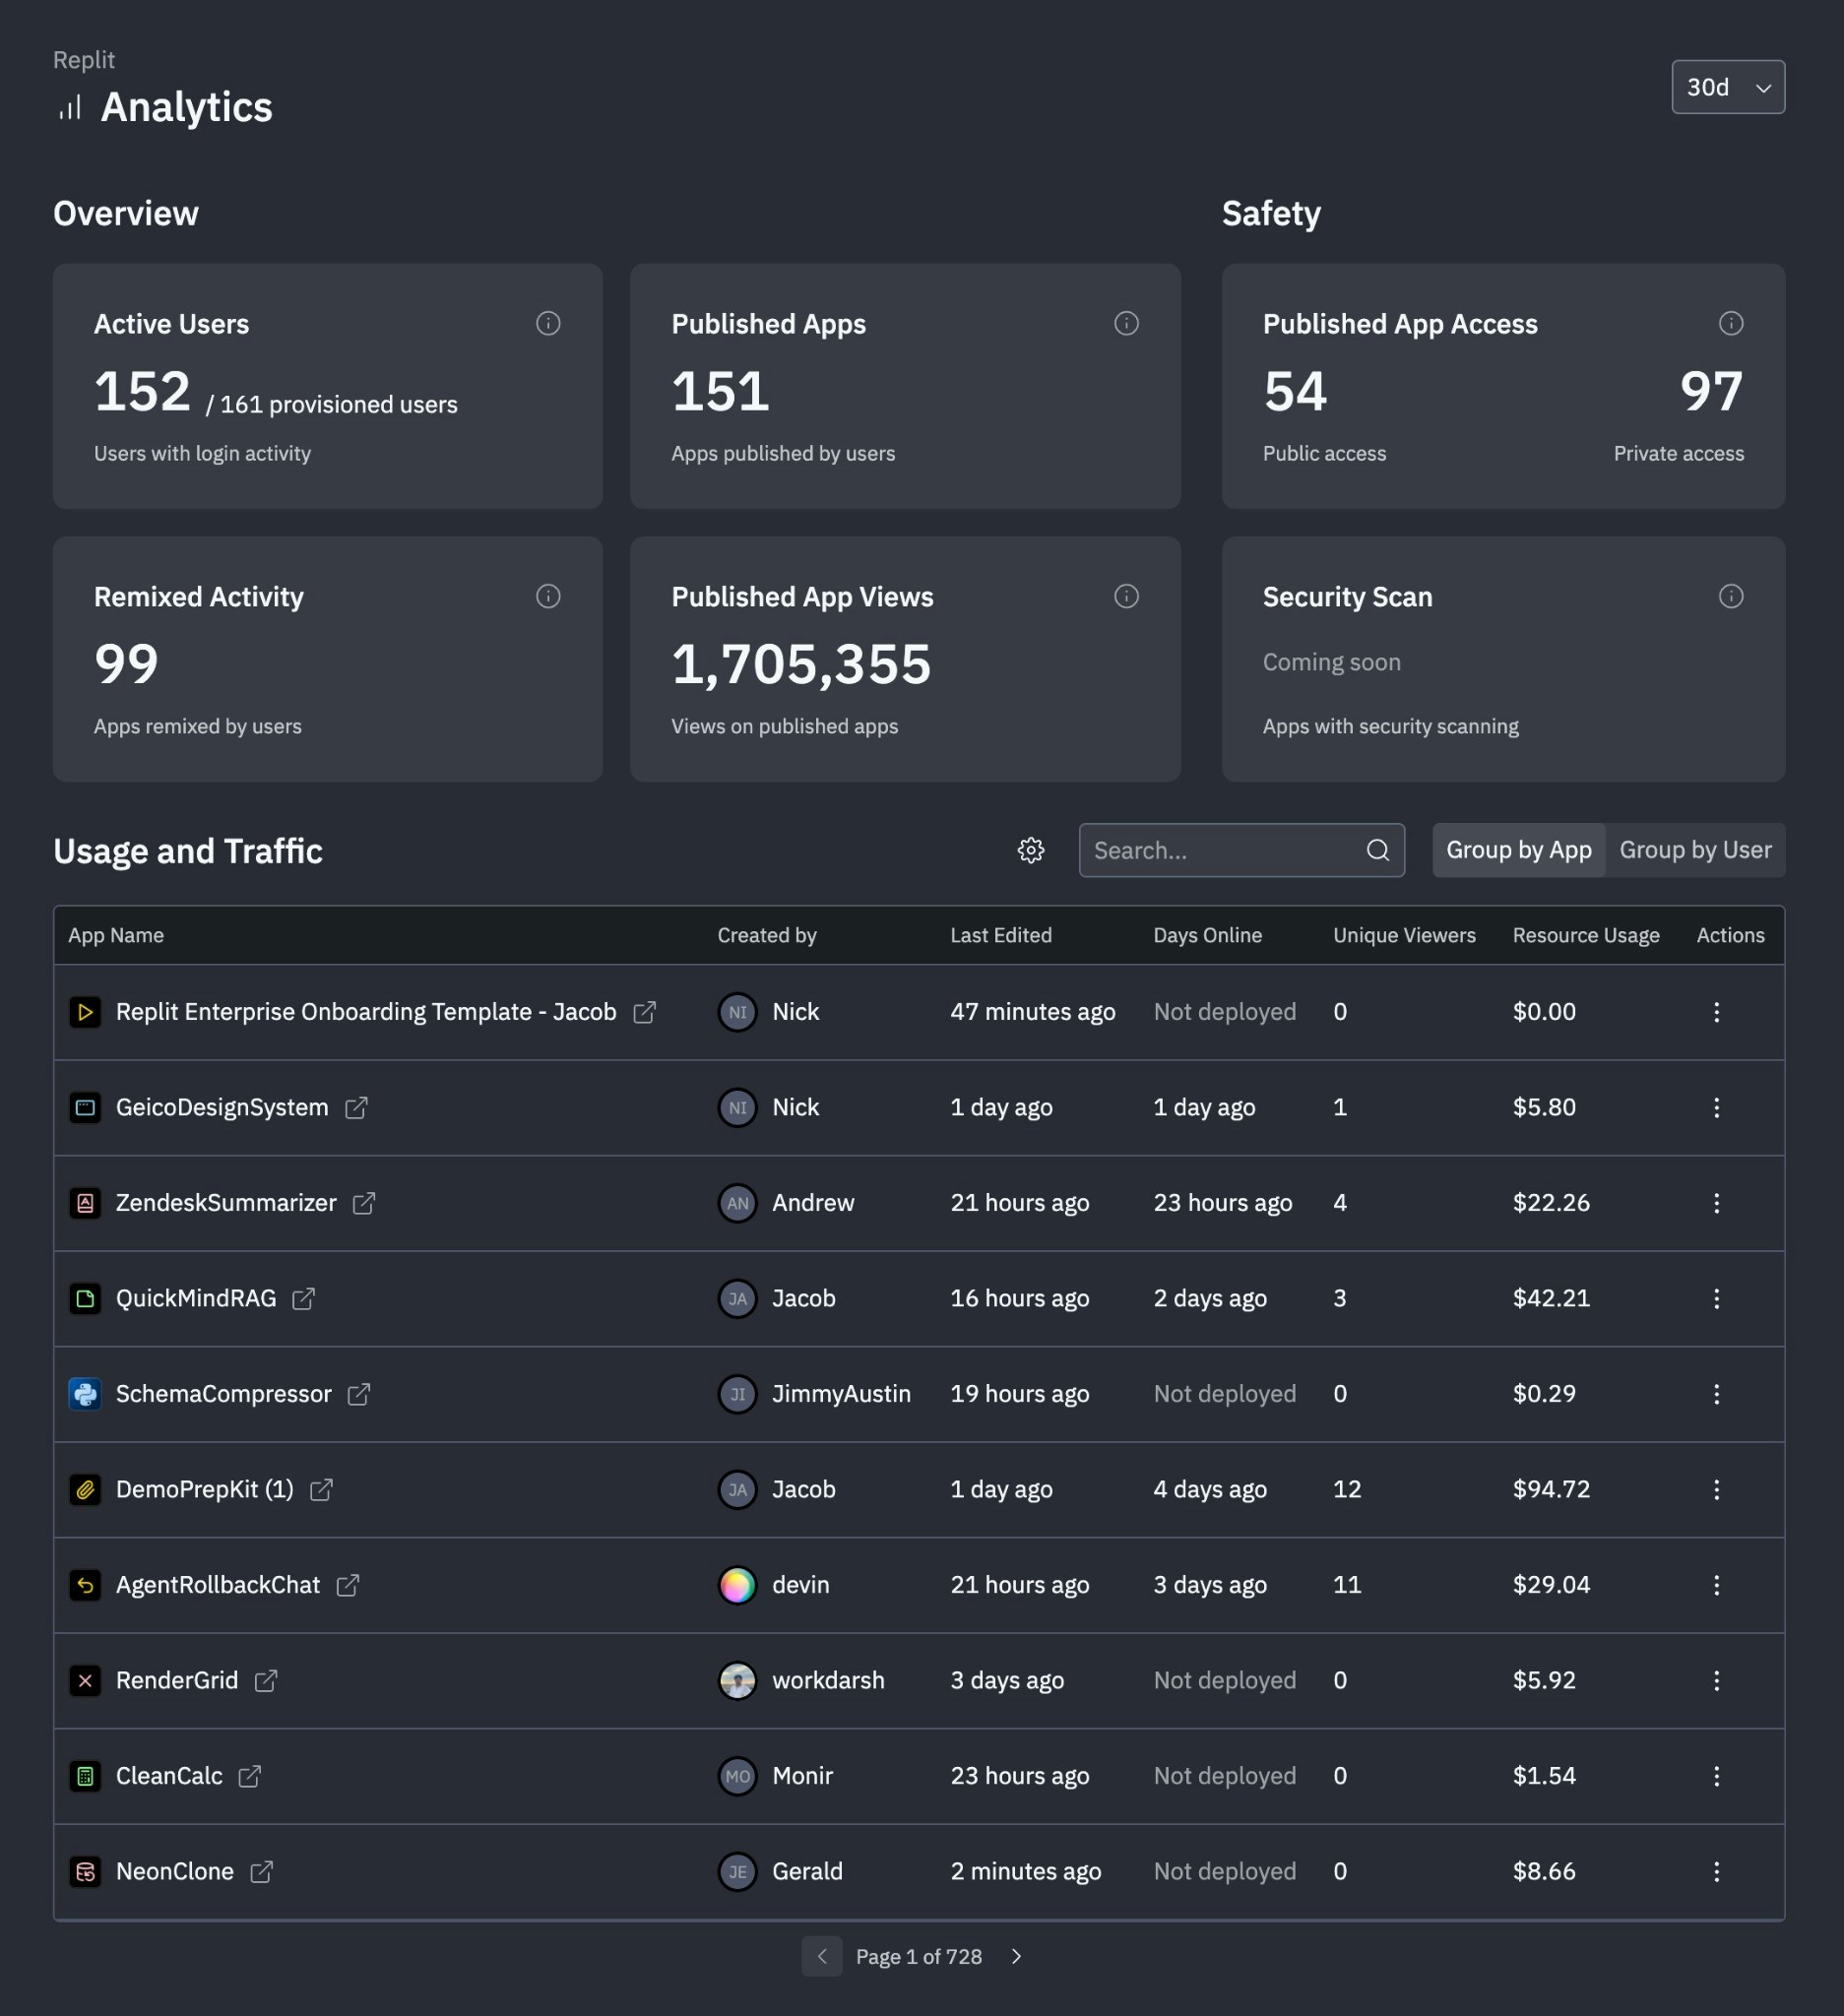
Activity monitoring
See how your organization engages with Replit:- View active members and their contribution patterns
- See collaboration activity across teams
- Identify usage trends over time
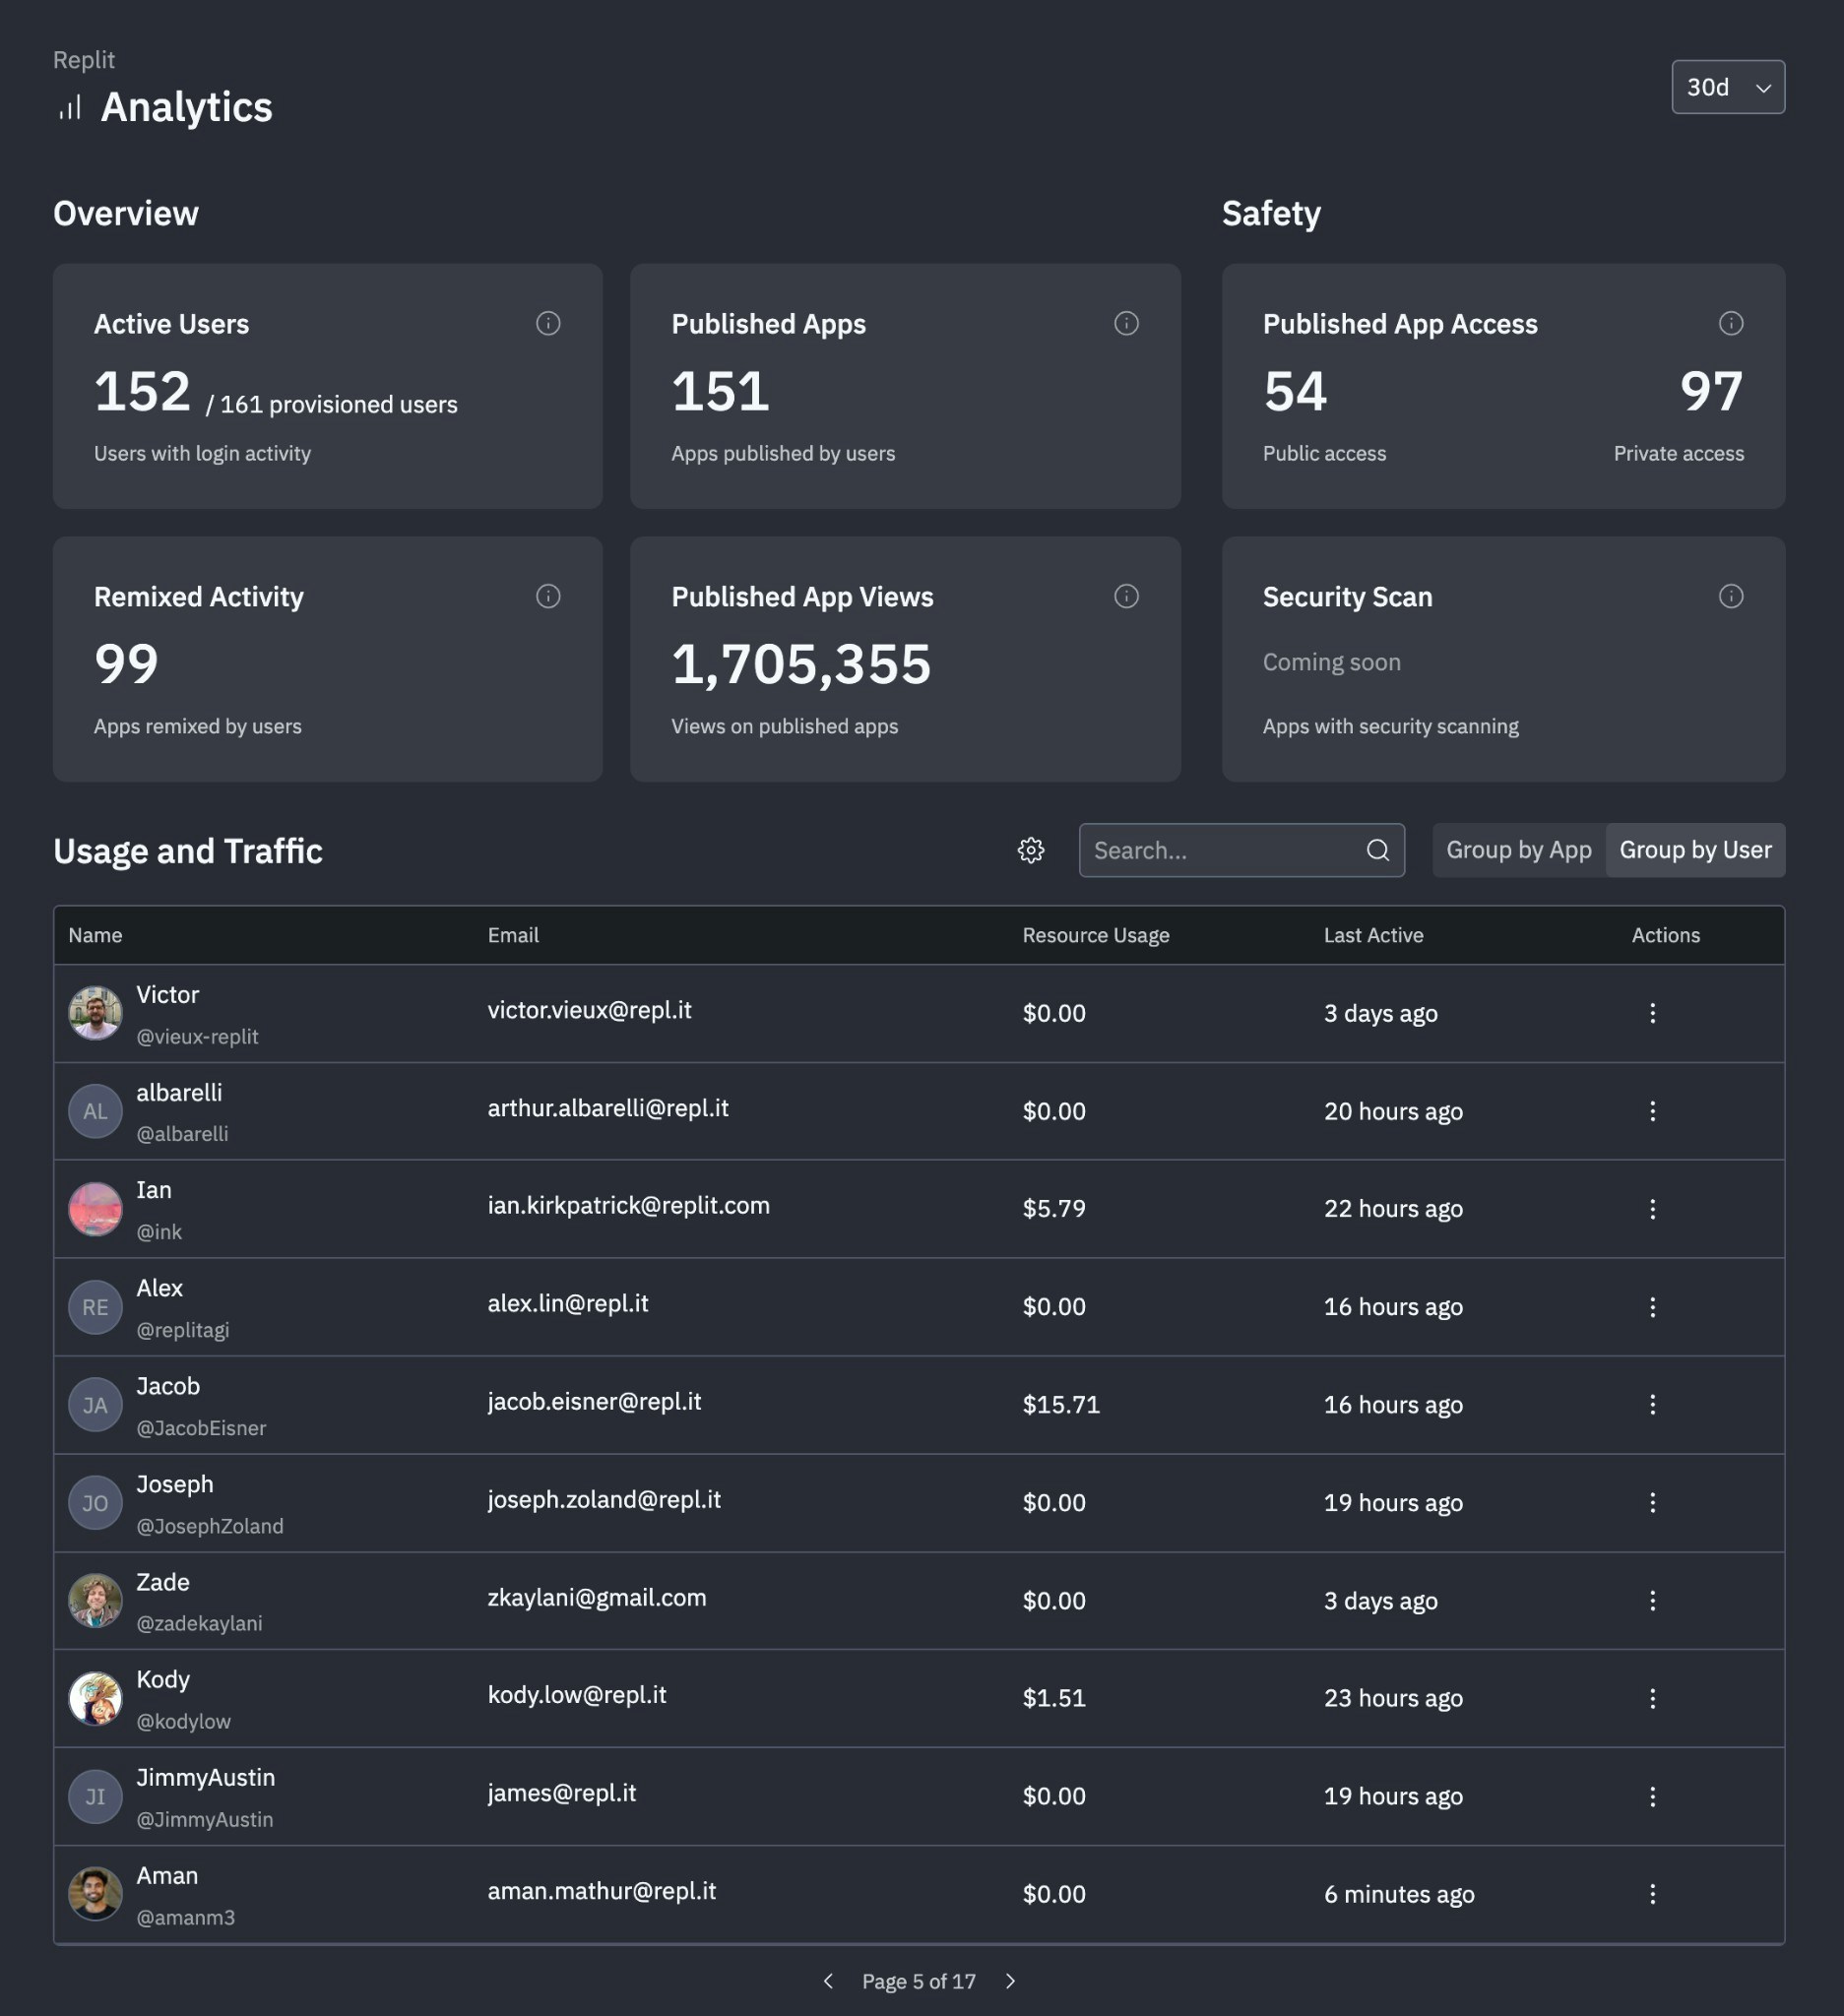
Resource usage tracking
View spending by member and app:- See resource consumption broken down by team member
- View usage patterns across individual apps
- Identify high-consumption apps and members
Publishing oversight
See your organization’s published app activity:- View total published apps with public vs. private access breakdowns
- See publishing frequency, app views, and remix activity
- Review days online, unique viewers, and resource usage per app
Cost management
View resource consumption and costs across your organization:- See spending breakdowns by member, team, or app
- Compare costs against budgets and allocations
- Export usage reports for internal accounting
Accessing the dashboard
To open the Analytics Dashboard:- Go to replit.com and sign in to your Enterprise account.
- Select Analytics from the left navigation on the home page.
Contact your dedicated account manager for help using your Analytics Dashboard.