Preview is the new name for Webview.
Features
Preview includes the following functionality to let you seamlessly test and debug your web apps:- Live web view: See your app and interact with it without leaving your browser tab
- Developer tools: Use built-in tools to diagnose problems quickly
- Responsive testing: View your app in different mobile device screen sizes
Usage
The Preview tool automatically opens when you run a web app. You can toggle this behavior in the User Settings tool under the Automatic Preview setting. The following instructions explain how to open Preview.How to access Preview
How to access Preview
From the left Tool dock:
- Select
 All tools to see a list of Project Editor tools.
 - Select
 Preview.
- Select the
 magnifying glass at the top to open the search tool
 - Type “Preview” to locate the tool and select it from the results.
Location bar
The location bar at the top of the Preview tab includes the following tools:- Back button: Navigate to the previous page in the browsing history
- Forward button: Navigate to the next page in the browsing history
- App domain: View information about your Replit App’s temporary URL by selecting
{...}.replit.dev - Address field: View the current URL path or enter a new path
Browser tools
The browser tools on the right side of the location bar include the following functions:- Screen size: Select from different device screen size presets to test responsive designs
- Devtools: Toggle the developer tools pane
- New tab: Open your web app URL in a new browser tab
Building a mobile app? The Preview panel also supports previewing on an iOS Simulator or Android Emulator. See Native Mobile Apps for details.
Developer tools
Developer tools, powered by the Eruda open source project, help you perform the following tasks:- View and interact with the JavaScript console in the context of your app
- Inspect DOM elements
- Monitor network requests
- Configure display and behavior preferences
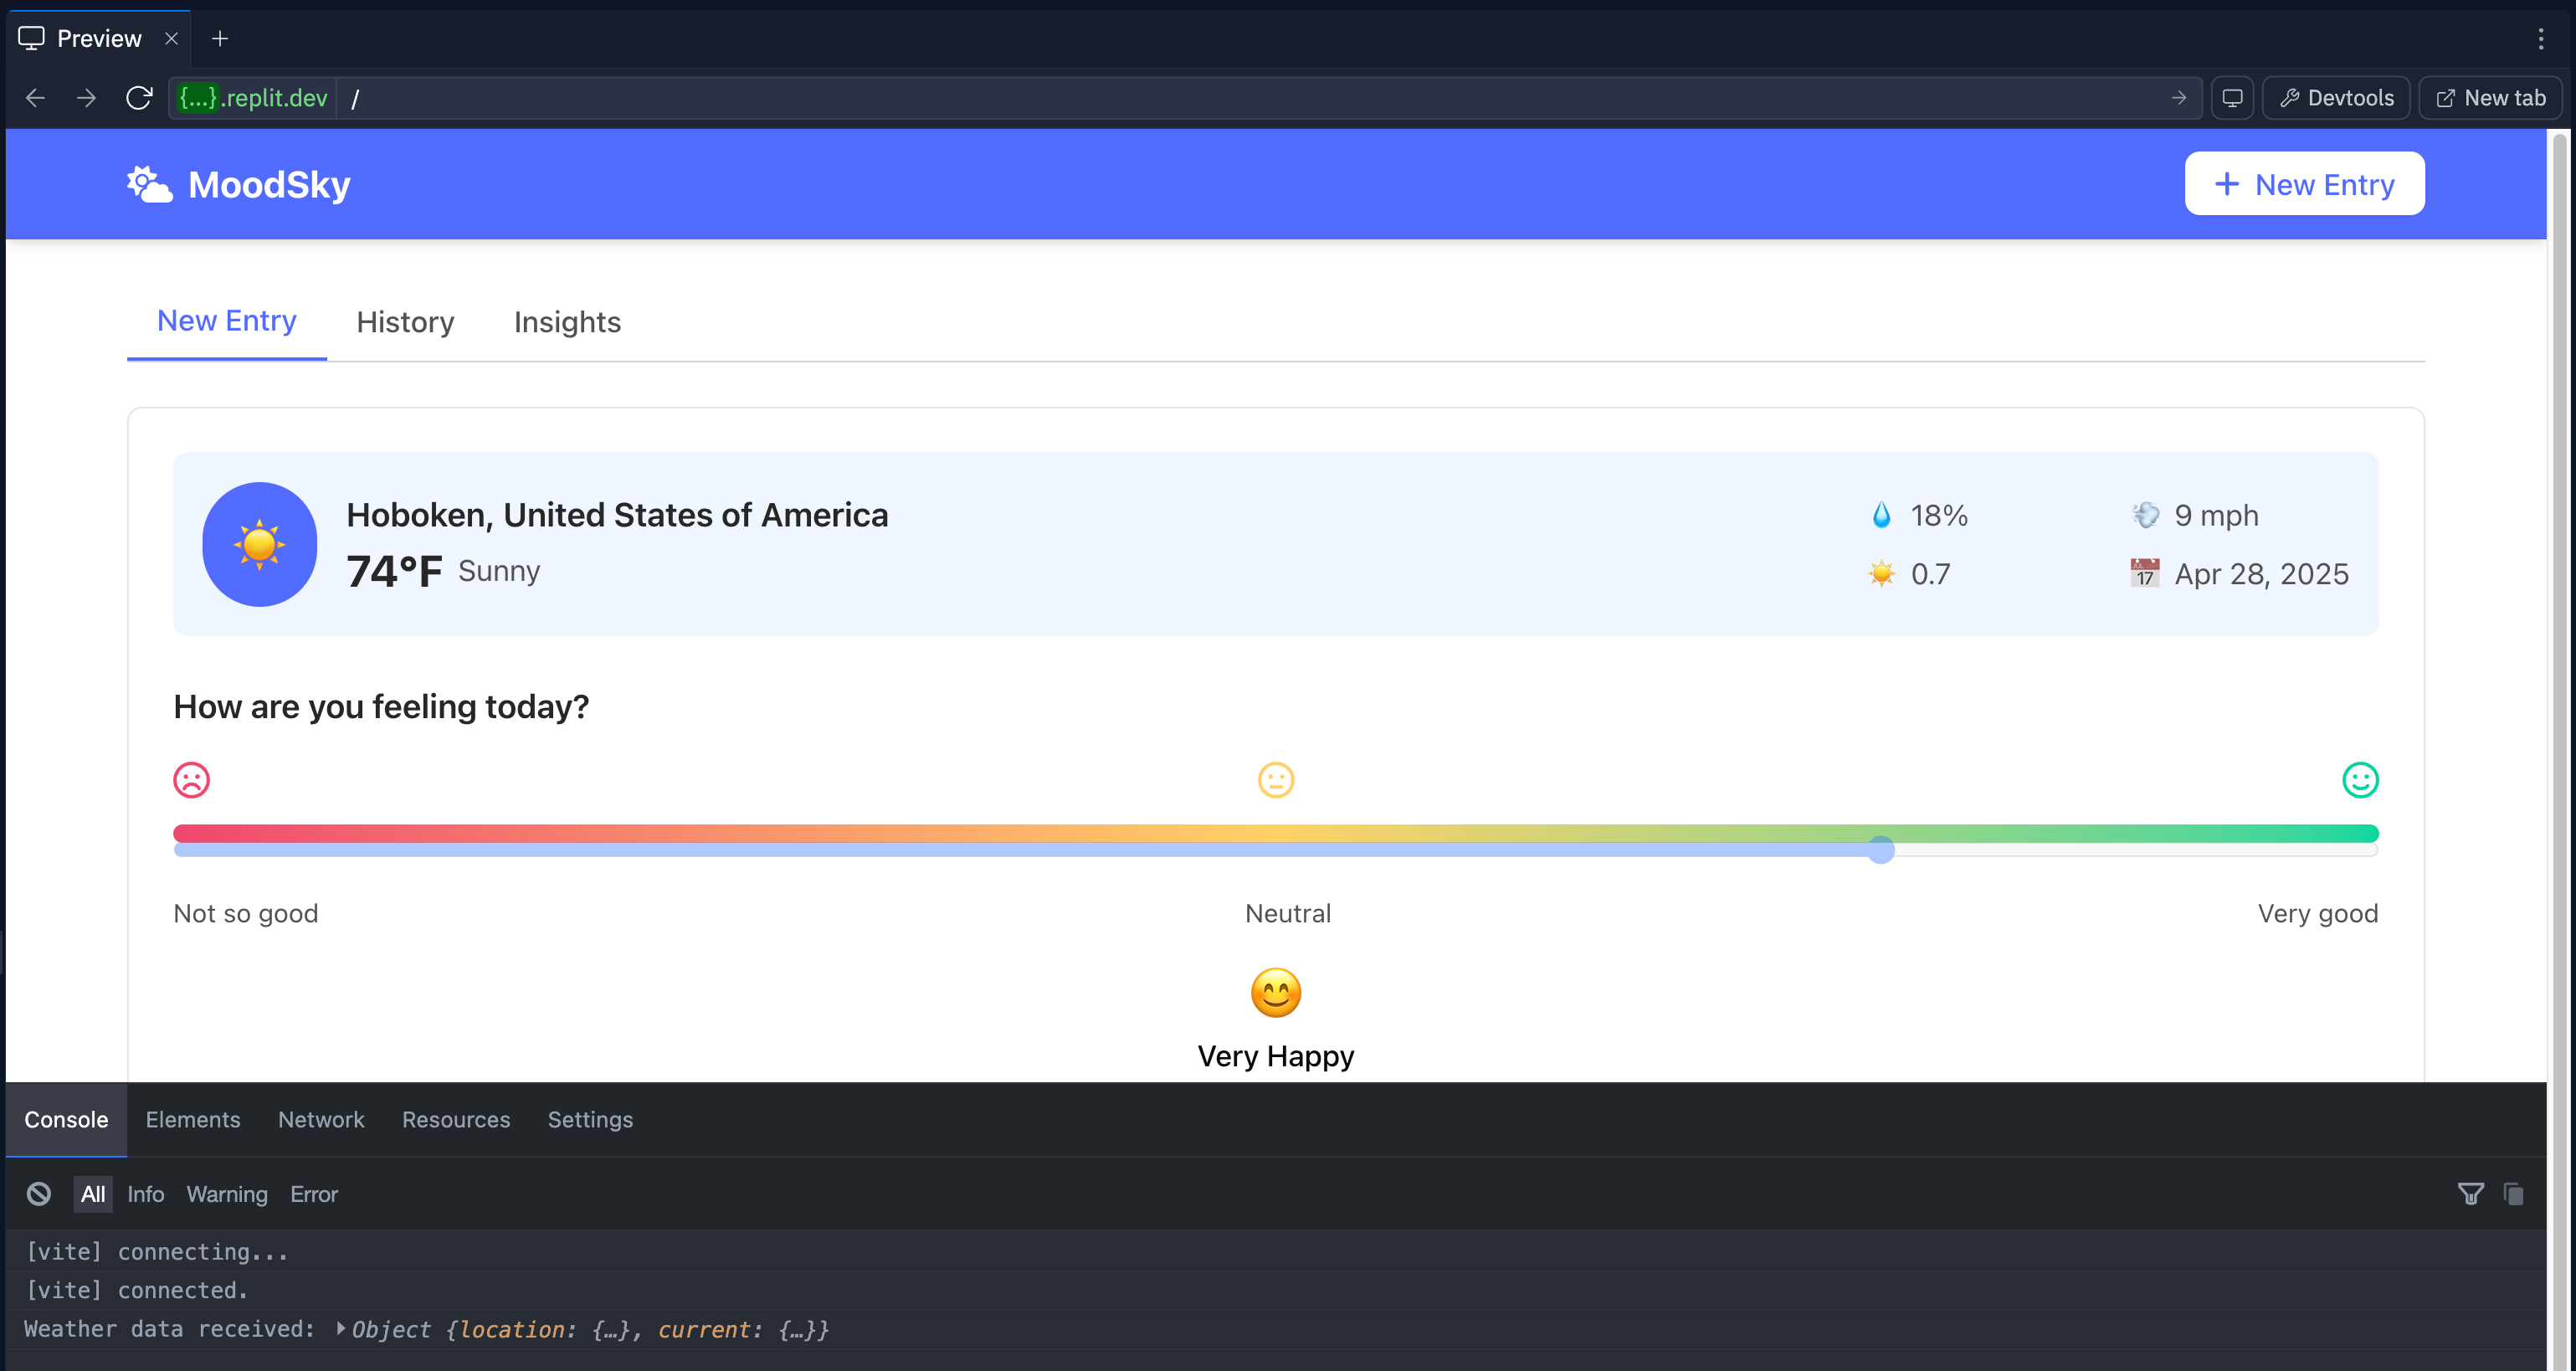
Console
The Console tab displays JavaScript logs generated by your application. In this tab, you can perform the following actions:- Clear output: Remove all console output by selecting the
 circle with slash icon.
 - Filter output: View console output filtered by type (All, Info, Warning, or Error).
- Filter matching text: Show output that matches by selecting the
 filter icon and entering the text.
 - Copy output: Copy selected console messages by selecting the
 copy button.
 - Run JavaScript code: Run JavaScript code in your app’s context by selecting the
 right angle brace. Enter the expression and select Execute.
Elements
The Elements tab lets you inspect and modify the DOM structure of the web page.- View element details: View details about the DOM element and the location in the HTML code
- Copy output: Copy selected console messages by selecting the copy button.
Network
The Network tab monitors requests initiated by the web page. In this tab, you can perform the following actions:- Track requests: View all network requests initiated by your app. Select a request to view details.
- Filter: View matching results by selecting the funnel icon to show results that match your text. Enter an empty filter to clear it.
- Copy: Copy storage information by selecting the copy button.
Resources
The Resources tab shows assets loaded by the page and browser storage, such as cookies and local storage. You can view and refresh lists for the following asset types:- JavaScript files
- Stylesheets
- Iframes
- Images
- View storage: Review local storage, session storage, and cookies.
- Filter: View matching results by selecting the funnel icon to show results that match your text. Enter an empty filter to clear it.
- Clear: Delete all data for that storage type by selecting the clear button.
- Delete selected: Remove storage items by selecting the
 “X” icon.
 - Copy: Copy storage information by selecting the copy button.
Settings
The Settings tab allows you to customize the developer tools’ appearance and behavior. This tab includes customization options for the following:- Tool settings: Customize options that apply to each tool tab
- JavaScript controls: Specify JavaScript behavior options, such as turning it off to test how your app behaves
- Display preferences: Change the theme, panel size, transparency, and other behavior of the developer tools