Features
Console provides the following tools to help you understand your app’s behavior:- Real time logging: View your app’s output as it happens
- AI assistance: Receive suggestions to fix errors reported in the logs
- Run history: Show logs from prior runs to track changes
Usage
You can access the Console tool directly in your Project Editor.How to access Console
How to access Console
From the left Tool dock:
- Select
 All tools to see a list of Project Editor tools.
 - Select
 Console.
- Select the
 magnifying glass at the top to open the search tool
 - Type “Console” to locate the tool and select it from the results.
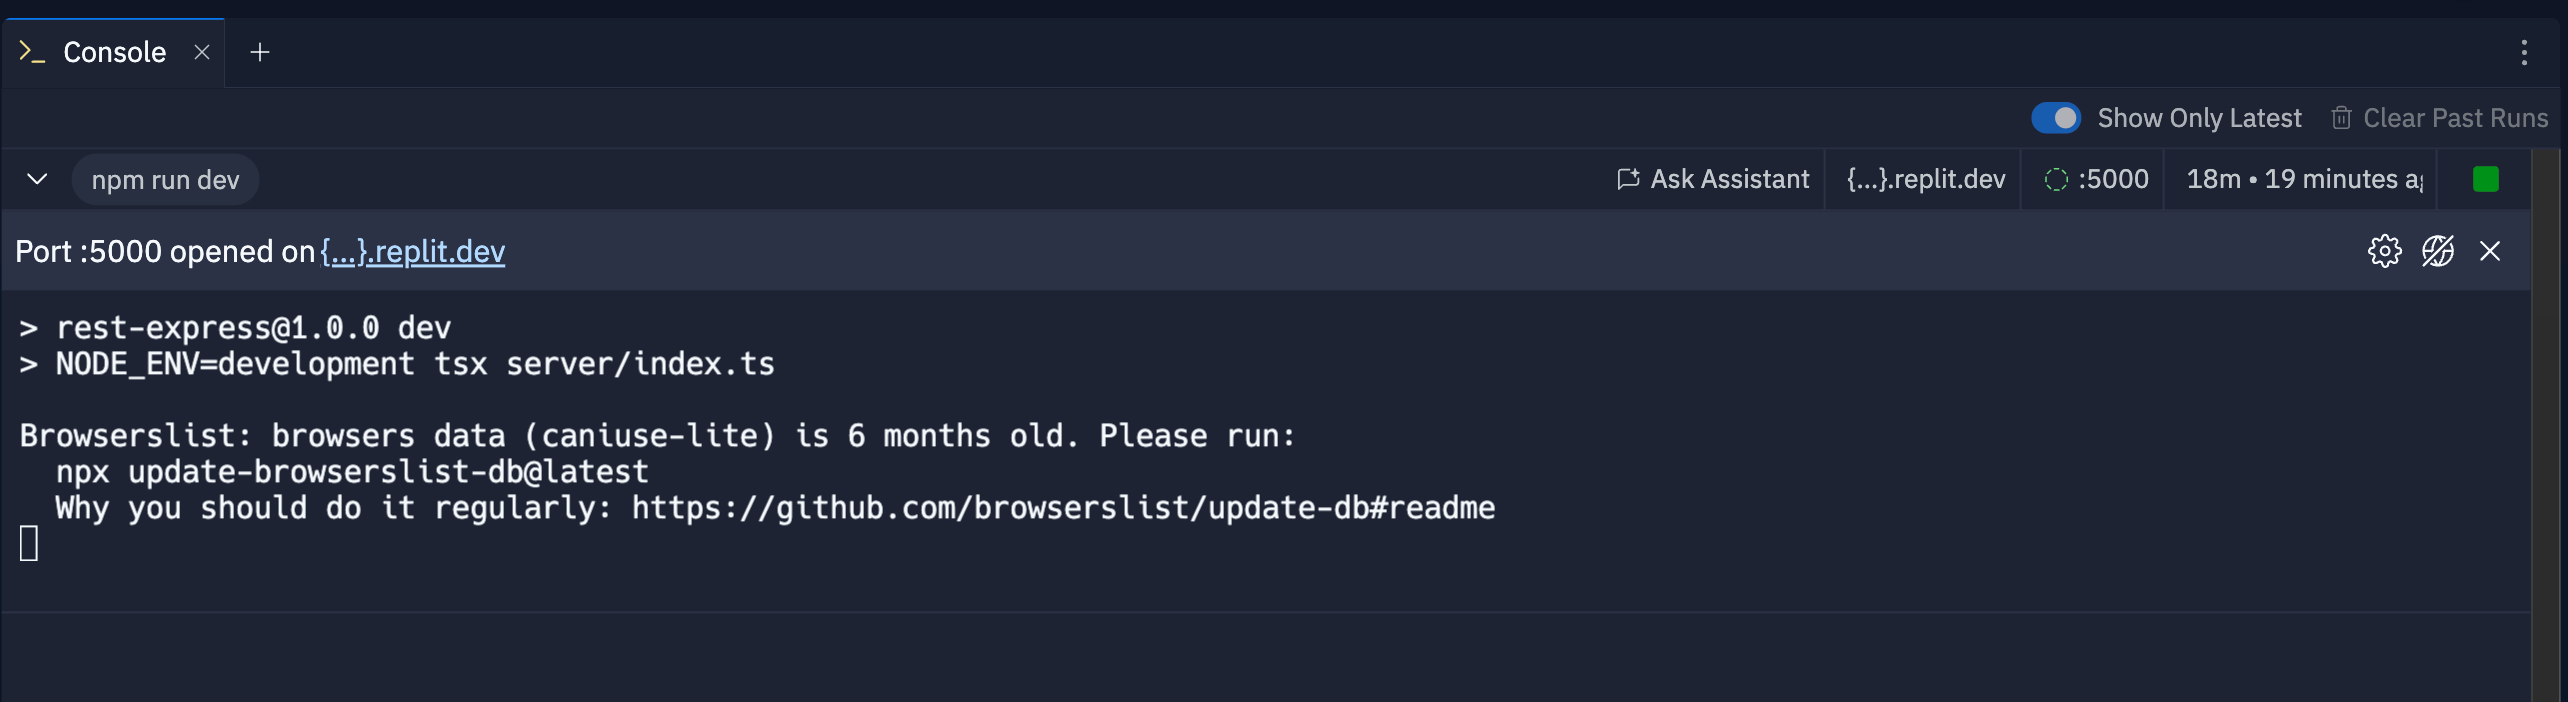
- The Command that executed your code
- Timestamp information
- Standard output and error logs
npm run dev command used to start the app and log messages from the run:
Client-side logs, such as those generated from HTML, CSS, and JS code, appear only in the Developer tools in the Preview tool.
AI-powered debugging
When you encounter errors or other information in the logs that you want to understand, select the Ask AI button at the top of the entry. This automatically opens the Agent tab and submits the log content for analysis.Log entry commands
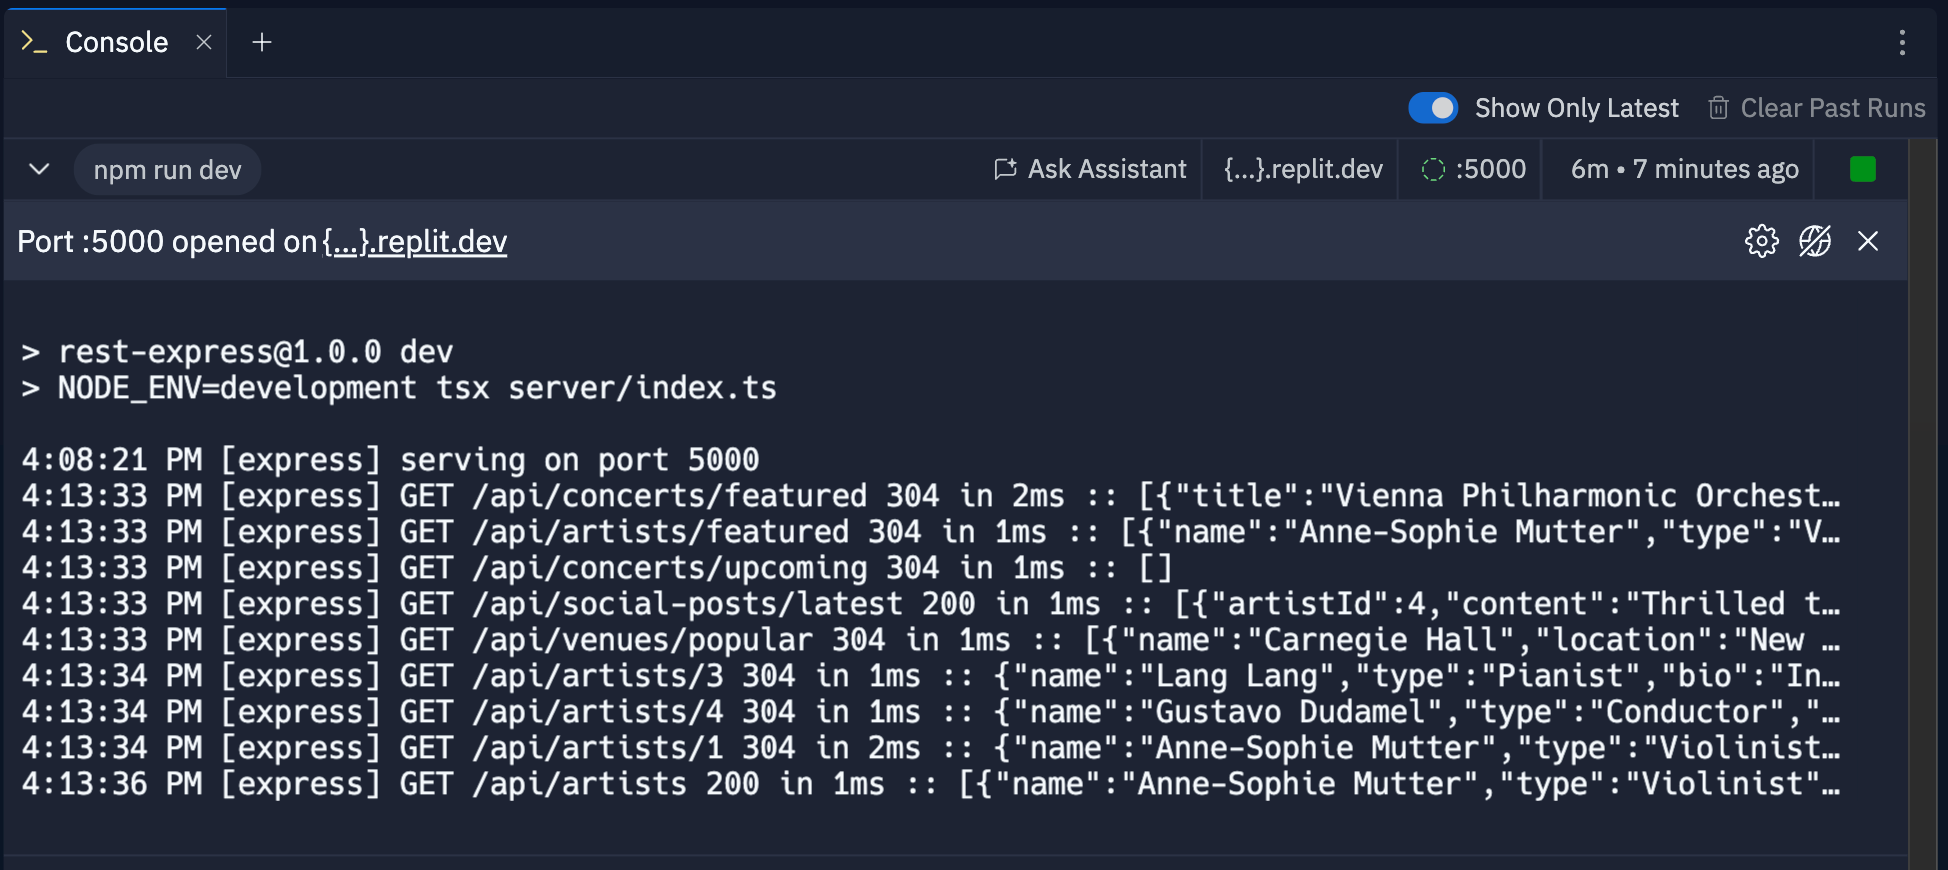
Console provides the following tools to manage your logs:- Show Only Latest: Toggle this control to the on position to display only the most recent run.
- Collapse entry: Select the
 downward arrow to the left of the command name to hide the logs.
 - Clear past runs: Select this to delete logs of prior runs. This action is irreversible.
Network availability
You can control the development version of your app’s availability online. To stop serving requests to the development URL, select the{...}.replit.dev text in the location bar.
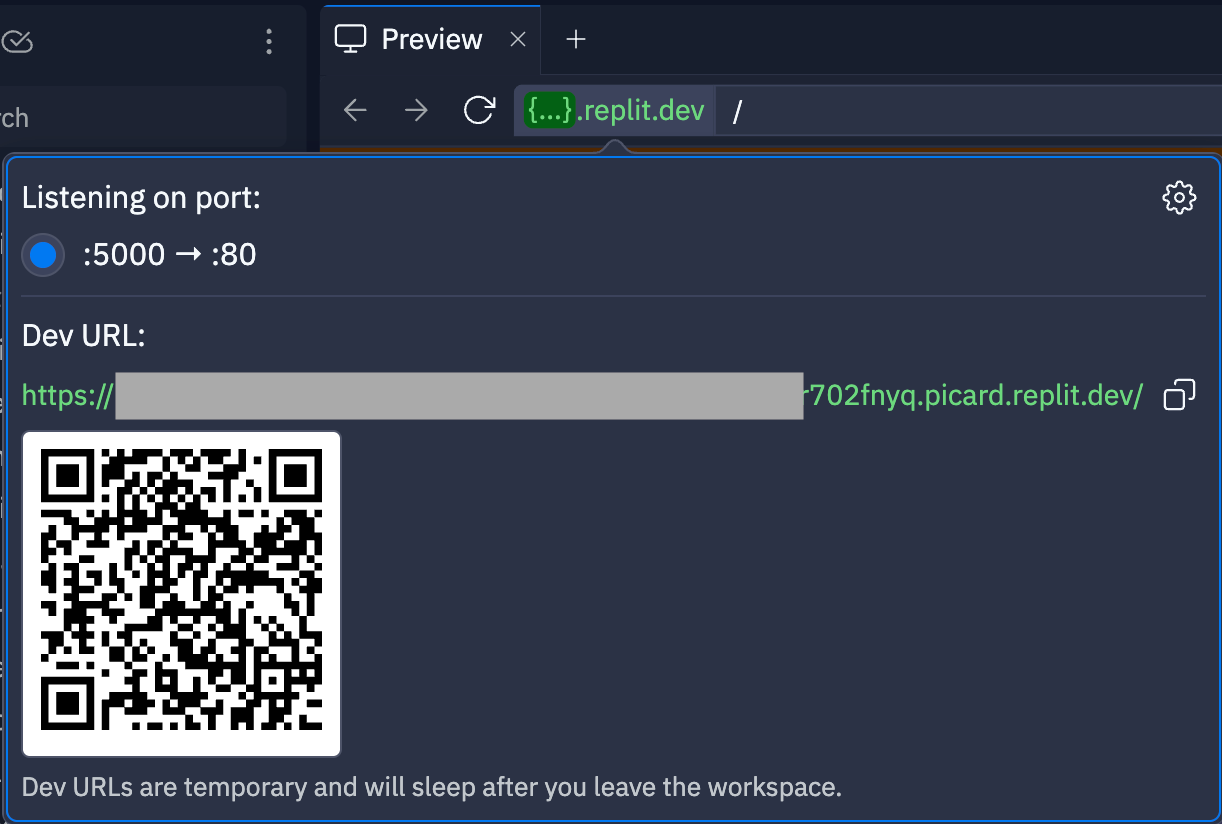
Your app remains accessible in the Preview tool even when set to stop serving requests to the development URL.