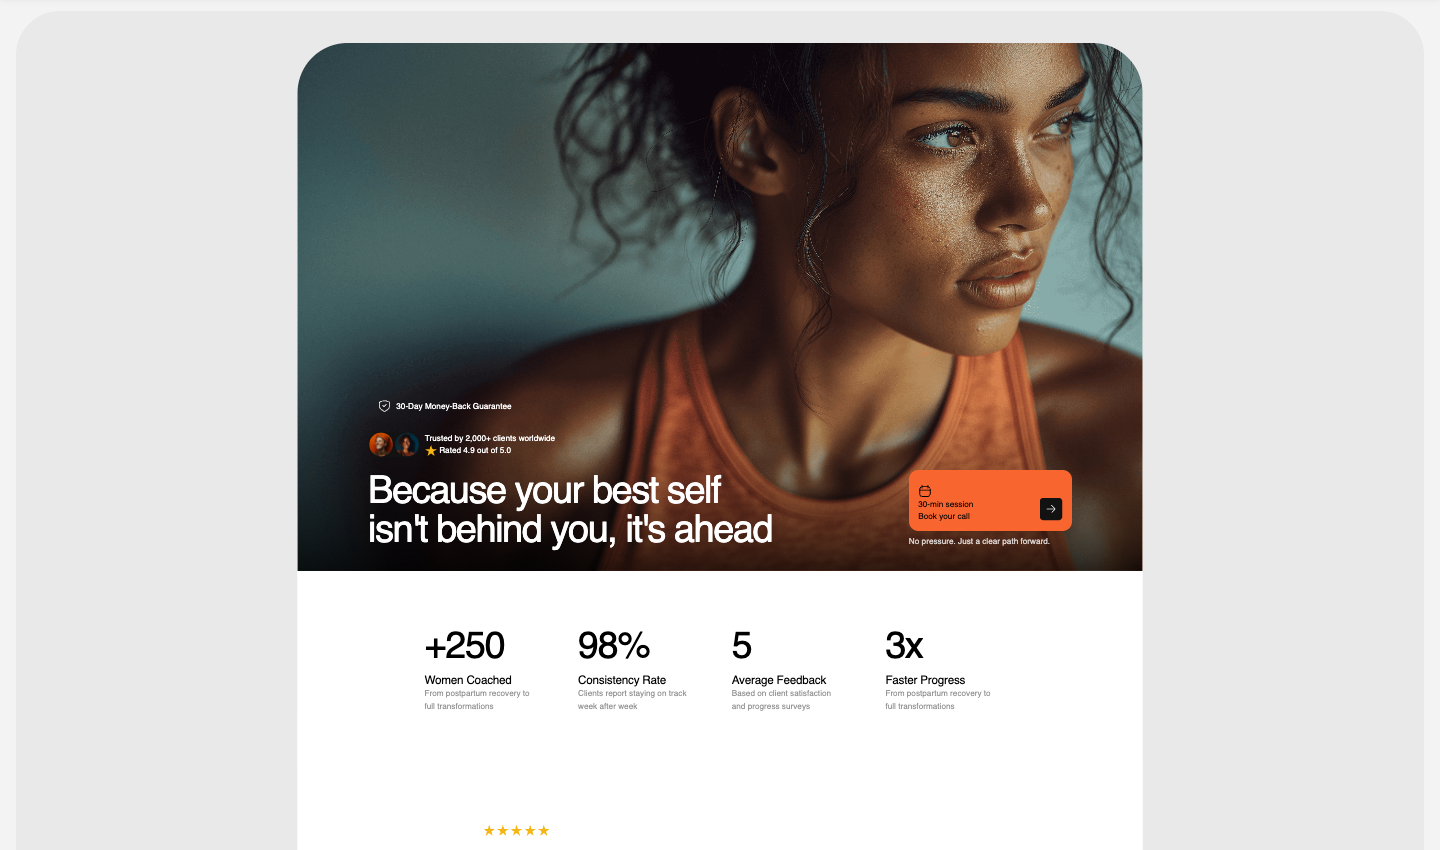
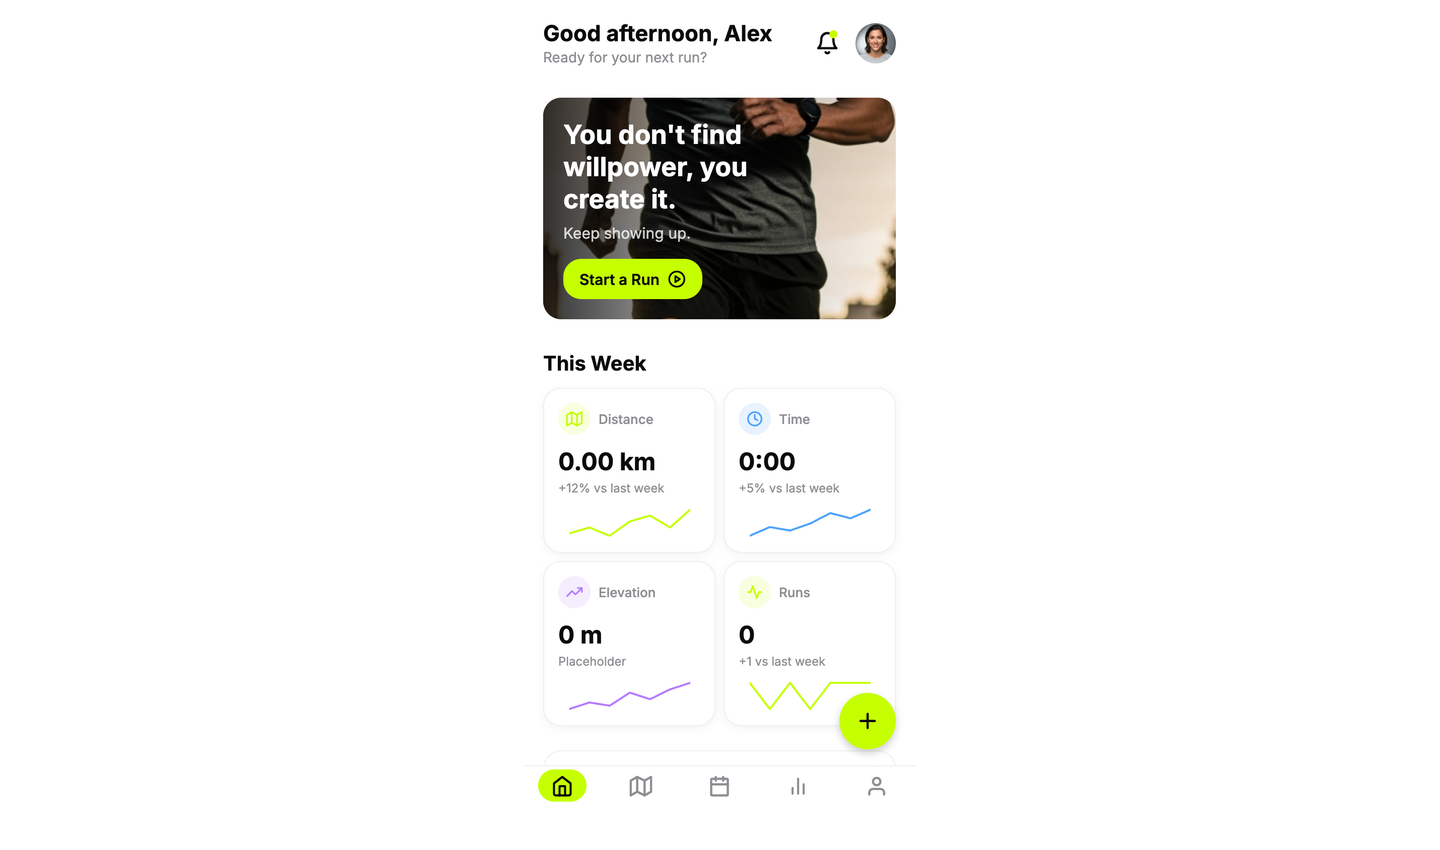
See what you can build
Replit can help you create apps that work and look polished enough to share.

Start building — it's free
Create your Replit account and ship your first app from a single prompt.
Getting started
Pick the project closest to what you want to make and open the guide. Each one walks you from a single prompt to a published URL you can share — no setup, no decisions to agonize over.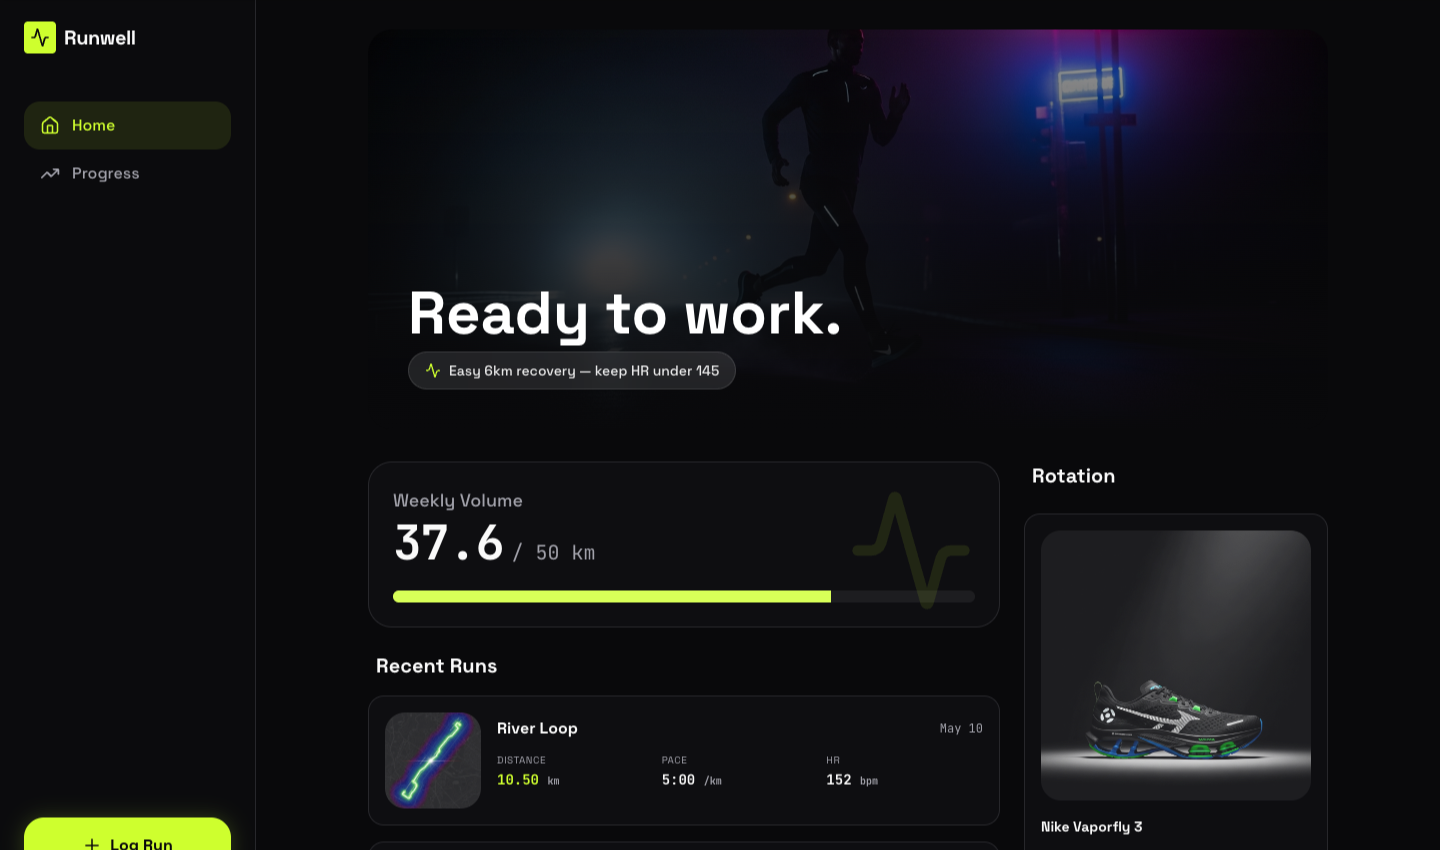
Build and publish your first app
A guided first project from prompt to a live URL.

Launch a landing page
Publish an offer or waitlist page people can respond to today.
Prototype a product idea
Turn a concept into a working flow you can test this week.
Turn a Figma design into an app
Import a frame, see it as a working app, refine from there.
Turn a spreadsheet, database, or API into useful insight.
Build a mobile app
Make something designed for phones — no Xcode, no Android Studio.
Import an existing project
Already have code, a design, or a project on another platform? Import it into Replit and continue with Agent.Import from GitHub
Bring a public or private repository into Replit and get it running.
Import from Figma
Convert a Figma frame into an interactive React app.
Import from Vercel
Pull in the GitHub repository behind a Vercel project.
Import from Bolt
Export from Bolt to GitHub, then import in Replit.
Import from Lovable
Export from Lovable to GitHub, then import in Replit.
Import from ZIP
Upload a
.zip archive and continue building with Agent.