> ## Documentation Index
> Fetch the complete documentation index at: https://docs.replit.com/llms.txt
> Use this file to discover all available pages before exploring further.
# Monitor your database
> Use the Monitoring tab to see which queries are running against your production database right now, and which ones are slowing your app down.
The **Monitoring** tab shows you what your database is doing: what's running at this
moment, and which queries take up the most time overall.
Monitoring is available for production databases only.
From the **Database** tool:
1. Select your production database.
2. Select the **Monitoring** tab.
3. Choose **Active queries** or **Query performance**.
## Active queries
A live snapshot of everything running against your database right now:
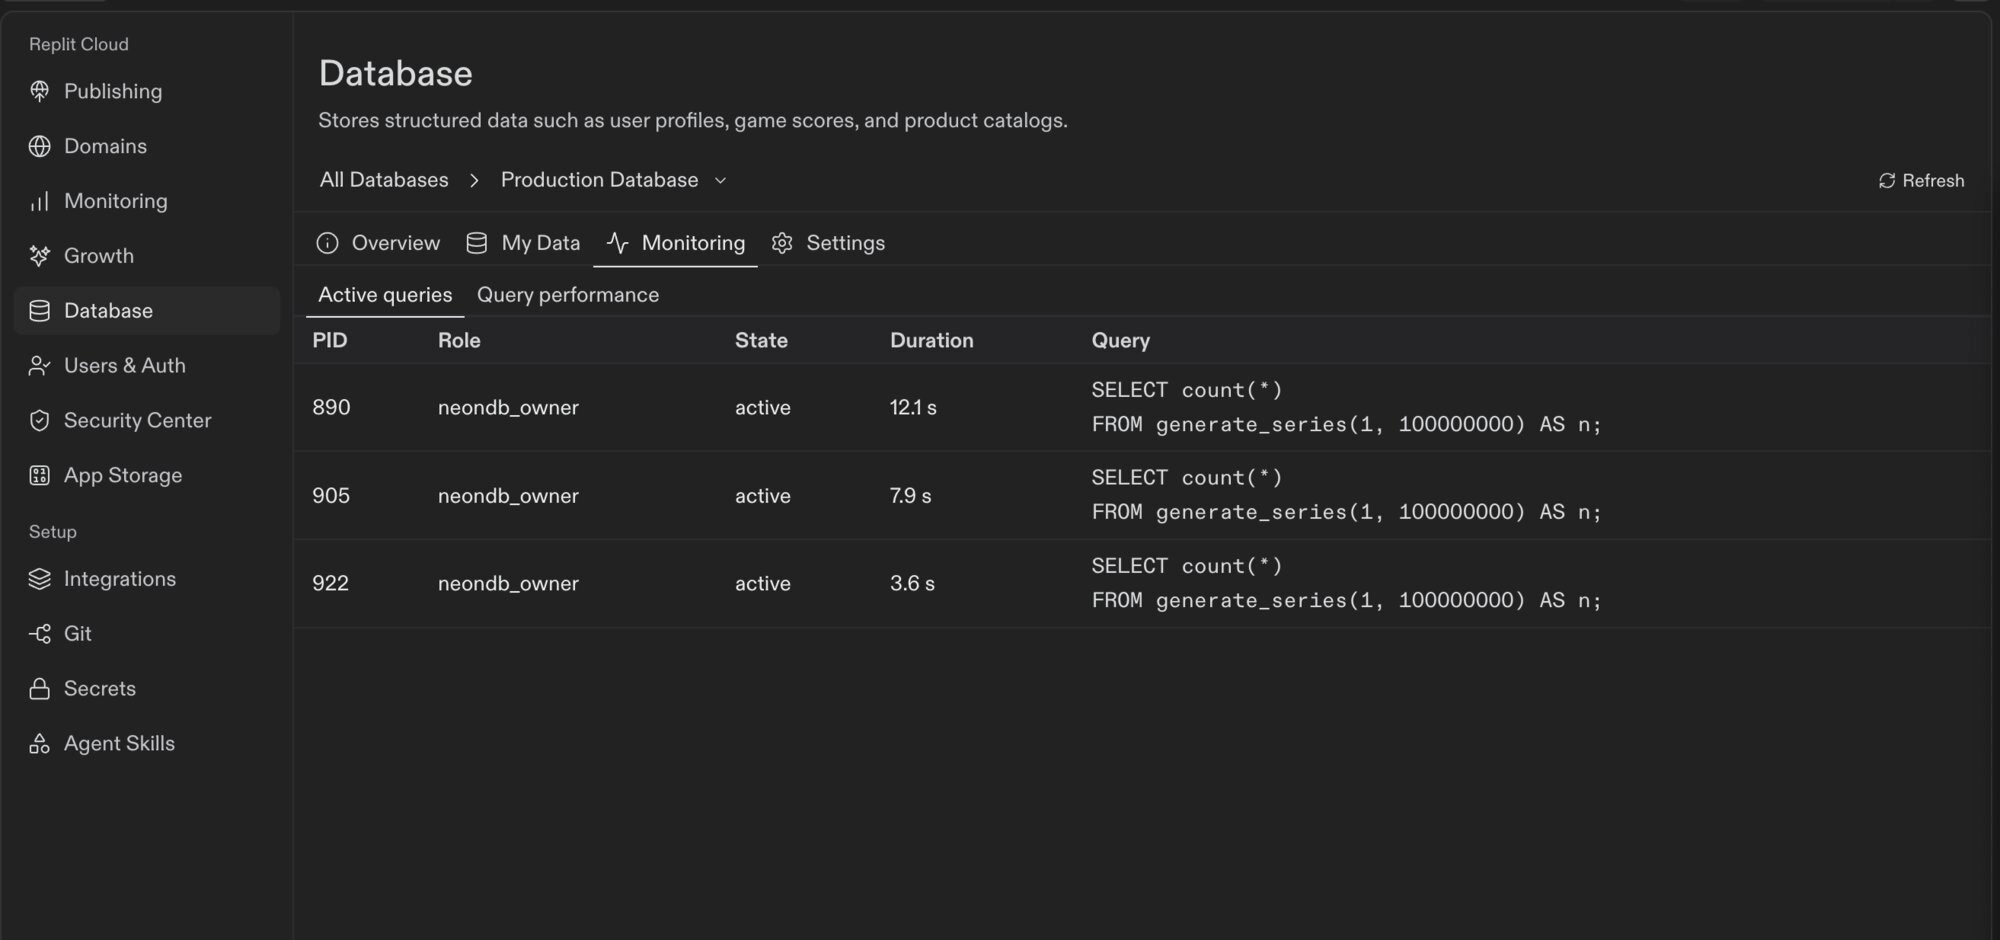 * **PID**: The process ID of the connection running the query.
* **Role**: The database user that opened the connection.
* **State**: `active` means a query is running. `idle in transaction` means a
transaction is open but doing nothing. It still holds locks.
* **Duration**: How long the current query has been running.
* **Query**: The statement itself.
This is a snapshot, not a log. Select **Refresh** to take a new one. Most queries finish in milliseconds, so an empty list is normal. Use this
view to catch queries that are running longer than they should. Fully idle connections
aren't listed.
## Query performance
Statistics for every query your database has run, with the most expensive first:
* **PID**: The process ID of the connection running the query.
* **Role**: The database user that opened the connection.
* **State**: `active` means a query is running. `idle in transaction` means a
transaction is open but doing nothing. It still holds locks.
* **Duration**: How long the current query has been running.
* **Query**: The statement itself.
This is a snapshot, not a log. Select **Refresh** to take a new one. Most queries finish in milliseconds, so an empty list is normal. Use this
view to catch queries that are running longer than they should. Fully idle connections
aren't listed.
## Query performance
Statistics for every query your database has run, with the most expensive first:
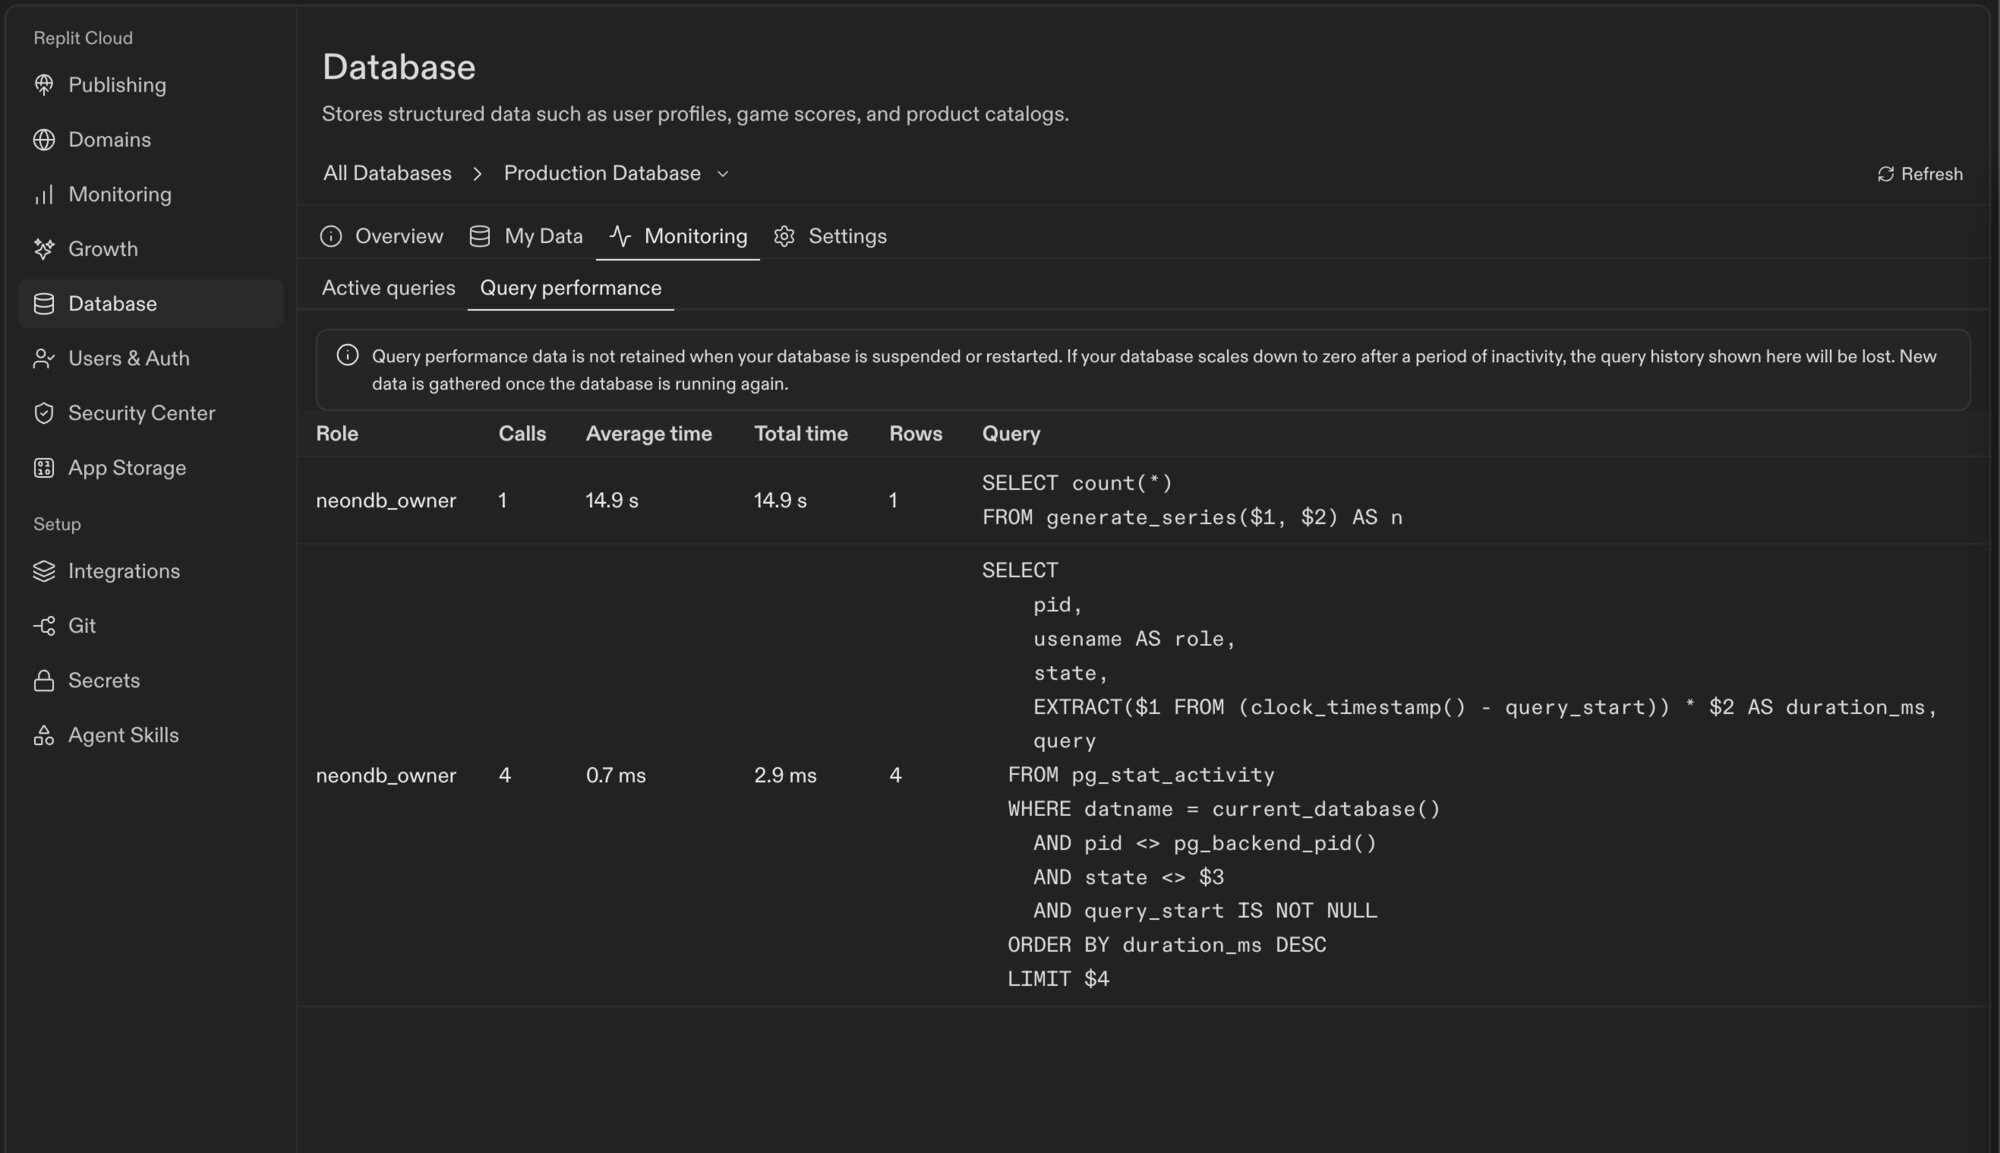 * **Calls**: How many times the query has run.
* **Average time**: The mean time per run. Individual runs aren't shown, only the average.
* **Total time**: Average time multiplied by calls. The table sorts on this.
* **Rows**: Total rows across all calls, not per call.
* **Query**: The statement, with your values replaced by placeholders such as `$1`.
Compare **Average time** against **Calls** to tell two problems apart. A high average
with few calls is a slow query, usually missing an index. A low average with many
calls is a fast query your app runs too often, which is a change to make in your code.
These statistics are not retained when your database is suspended or restarted. If
your database scales down to zero after a period of inactivity, the history resets
and starts collecting again once the database is running.
## Next steps
* [Work with your data](/features/data-and-storage/work-with-your-data): Browse, edit, and query your data.
* [Data recovery](/features/data-and-storage/data-recovery): Restore production data.
* **Calls**: How many times the query has run.
* **Average time**: The mean time per run. Individual runs aren't shown, only the average.
* **Total time**: Average time multiplied by calls. The table sorts on this.
* **Rows**: Total rows across all calls, not per call.
* **Query**: The statement, with your values replaced by placeholders such as `$1`.
Compare **Average time** against **Calls** to tell two problems apart. A high average
with few calls is a slow query, usually missing an index. A low average with many
calls is a fast query your app runs too often, which is a change to make in your code.
These statistics are not retained when your database is suspended or restarted. If
your database scales down to zero after a period of inactivity, the history resets
and starts collecting again once the database is running.
## Next steps
* [Work with your data](/features/data-and-storage/work-with-your-data): Browse, edit, and query your data.
* [Data recovery](/features/data-and-storage/data-recovery): Restore production data.