> ## Documentation Index
> Fetch the complete documentation index at: https://docs.replit.com/llms.txt
> Use this file to discover all available pages before exploring further.
# Analytics Dashboard
> View activity, resource usage, published apps, and costs with the Enterprise Analytics Dashboard.
The Analytics Dashboard is available exclusively for Enterprise customers.
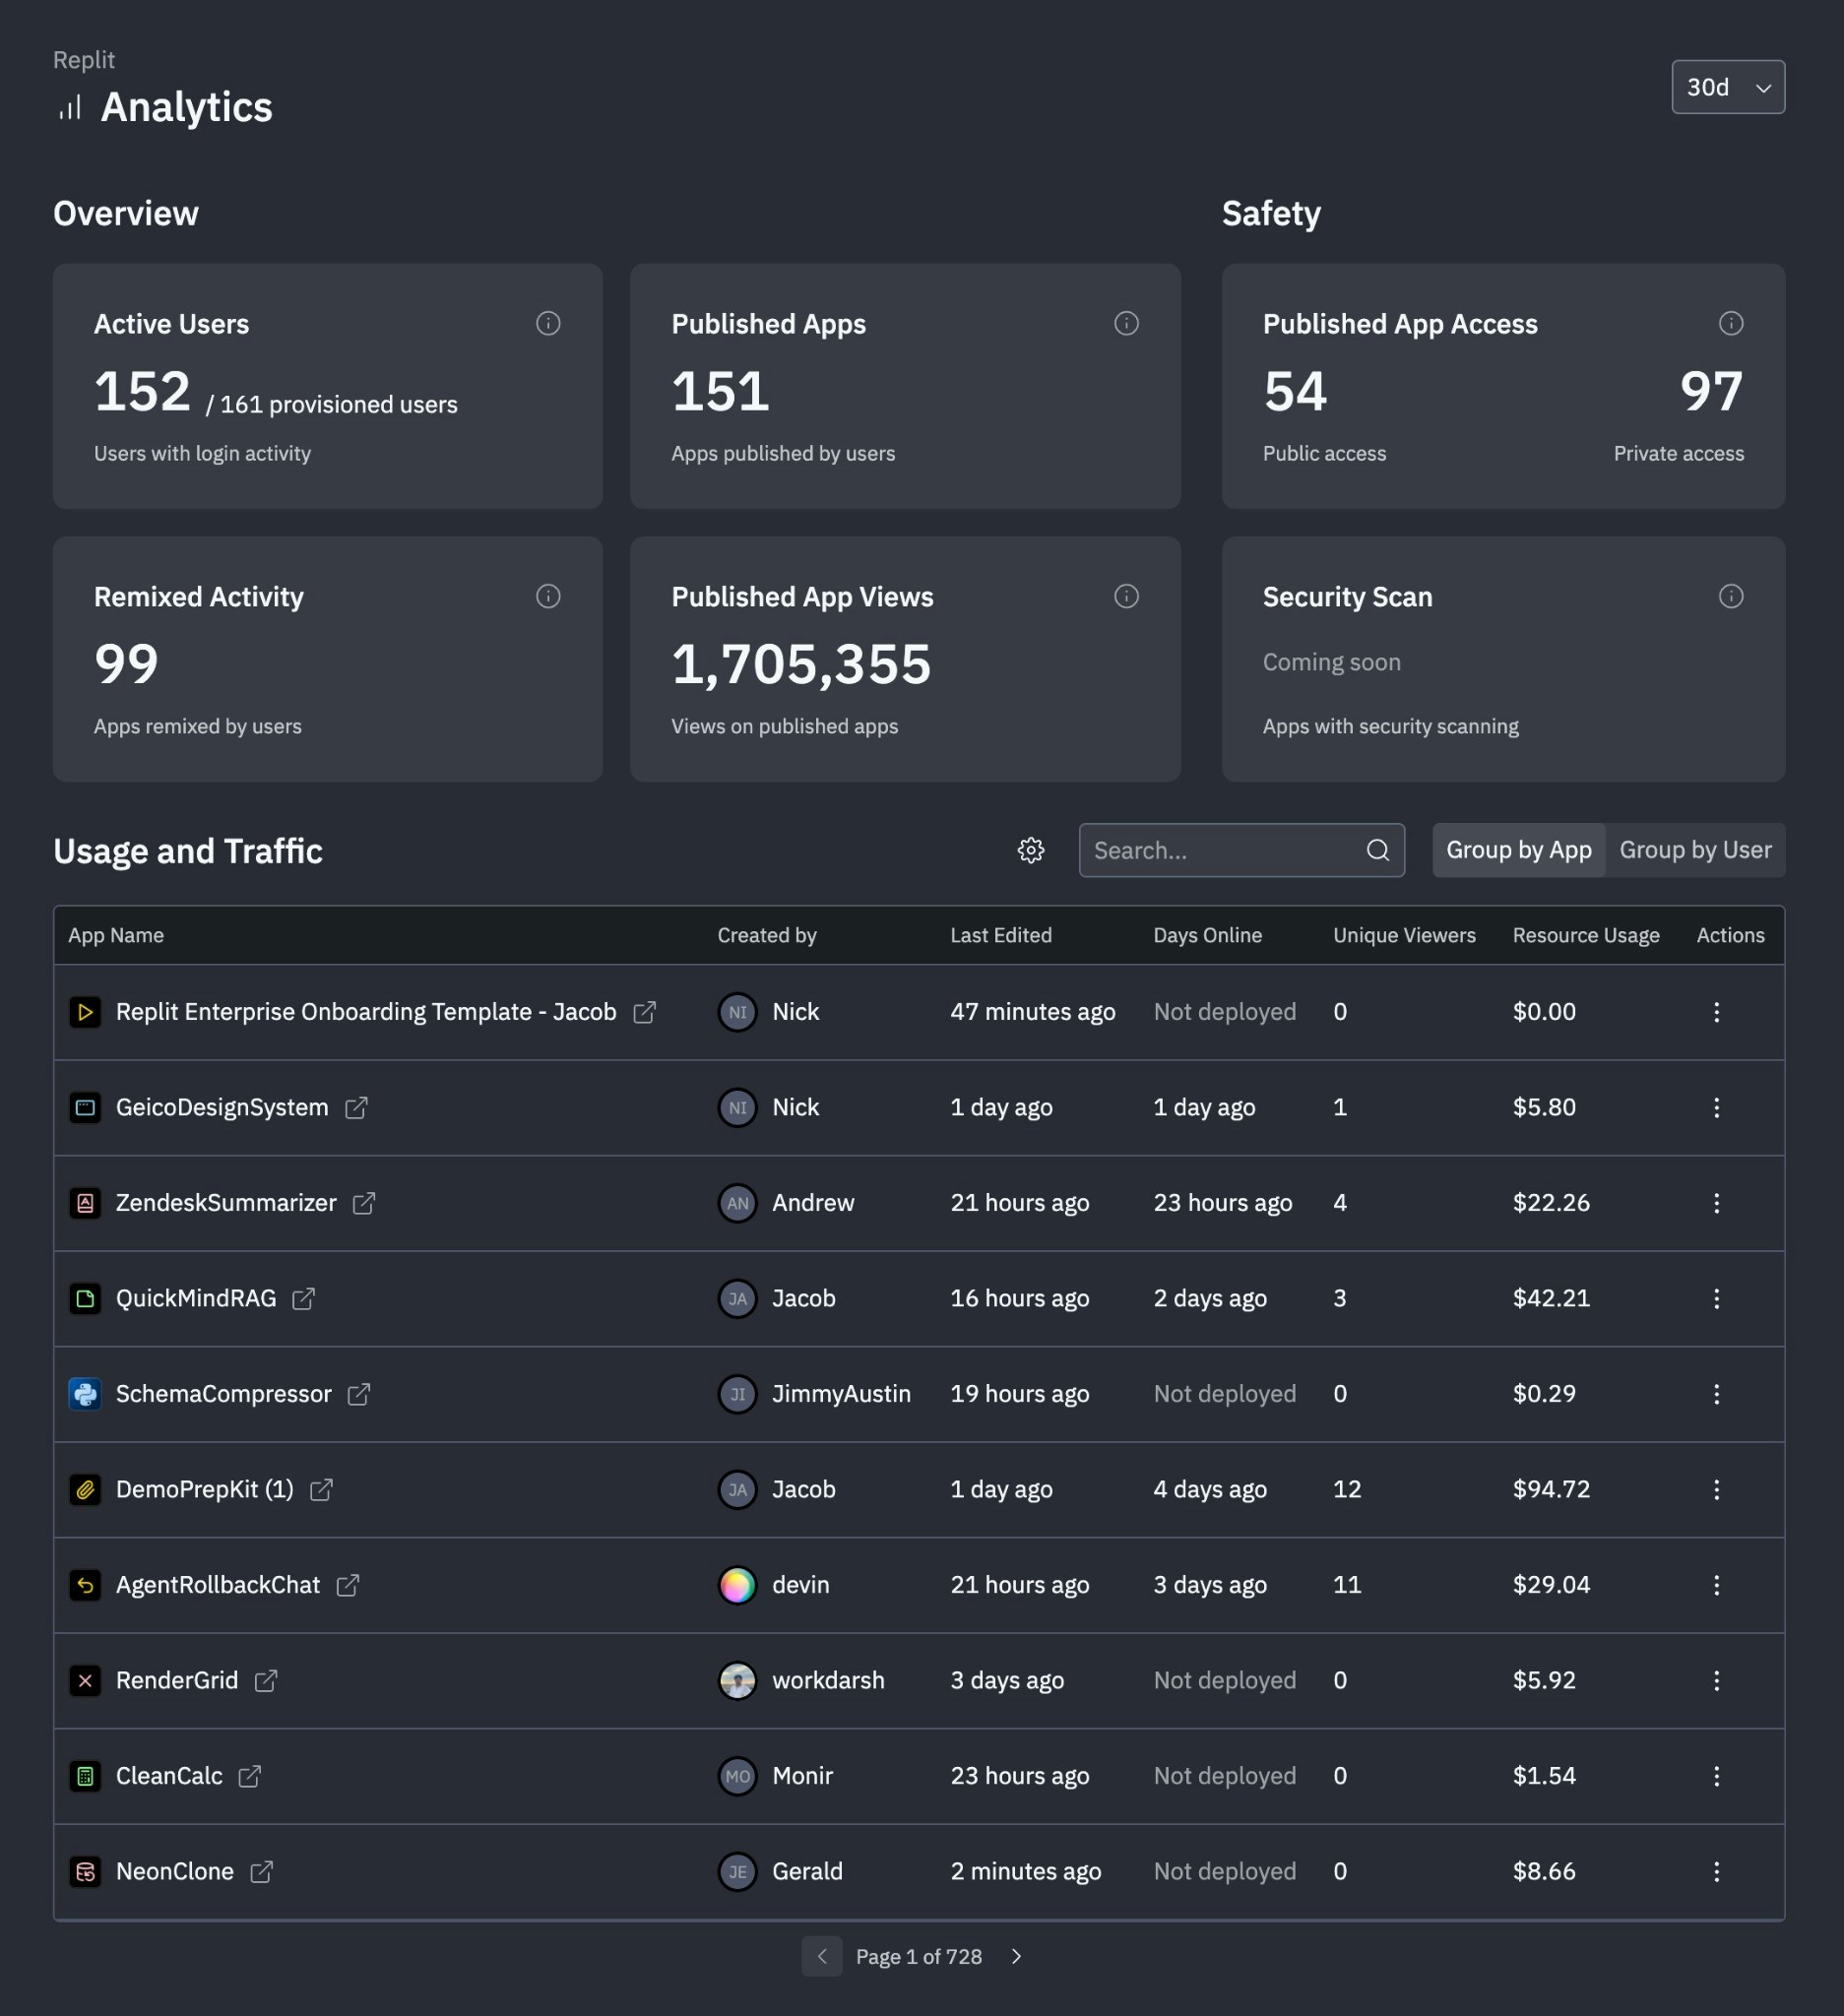
The Analytics Dashboard gives Enterprise admins comprehensive visibility into their organization's Replit usage. See engagement metrics, spending breakdowns, and published app performance from a centralized interface.
 ## Features
### Activity monitoring
See how your organization engages with Replit:
* View active members and their contribution patterns
* See collaboration activity across teams
* Identify usage trends over time
### Resource usage tracking
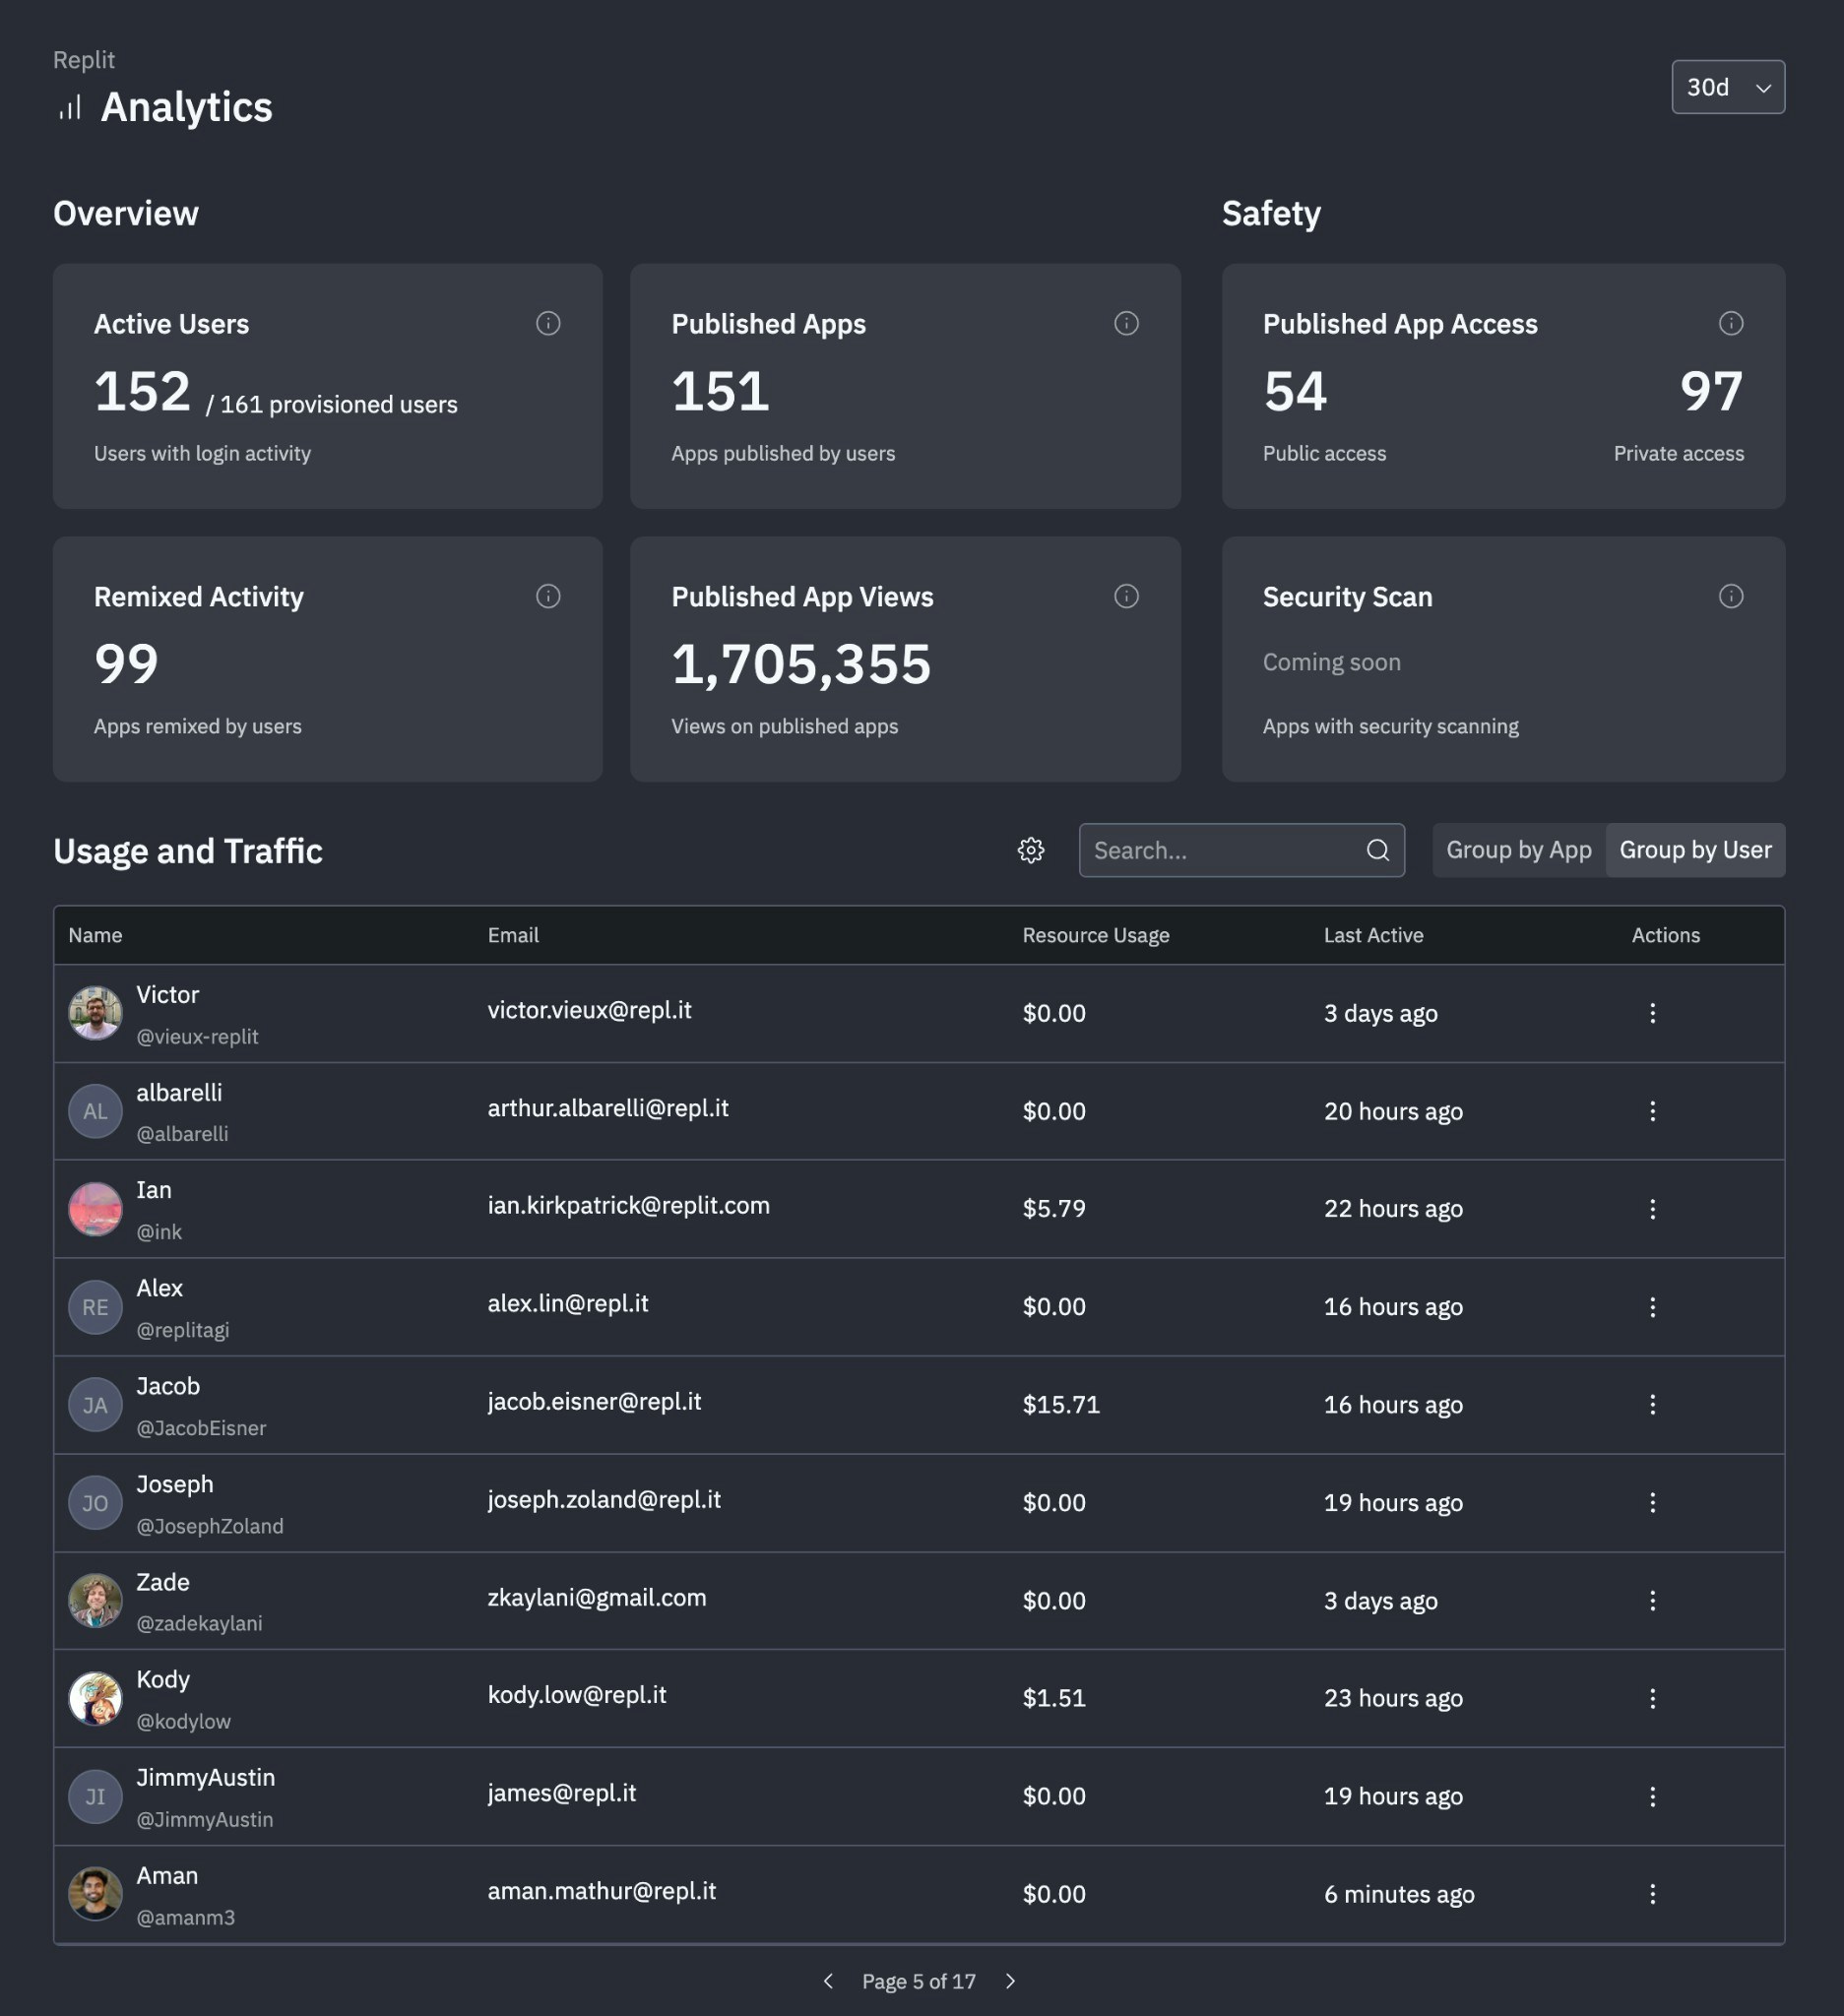
View spending by member and app:
* See resource consumption broken down by team member
* View usage patterns across individual apps
* Identify high-consumption apps and members
## Features
### Activity monitoring
See how your organization engages with Replit:
* View active members and their contribution patterns
* See collaboration activity across teams
* Identify usage trends over time
### Resource usage tracking
View spending by member and app:
* See resource consumption broken down by team member
* View usage patterns across individual apps
* Identify high-consumption apps and members
 ### Publishing oversight
See your organization's published app activity:
* View total published apps with public vs. private access breakdowns
* See publishing frequency, app views, and remix activity
* Review days online, unique viewers, and resource usage per app
### Cost management
View resource consumption and costs across your organization:
* See spending breakdowns by member, team, or app
* Compare costs against budgets and allocations
* Export usage reports for internal accounting
## Accessing the dashboard
To open the Analytics Dashboard:
1. Go to [replit.com](https://replit.com) and sign in to your Enterprise account.
2. Select **Analytics** from the left navigation on the home page.
Contact your dedicated account manager for help using your Analytics Dashboard.
### Publishing oversight
See your organization's published app activity:
* View total published apps with public vs. private access breakdowns
* See publishing frequency, app views, and remix activity
* Review days online, unique viewers, and resource usage per app
### Cost management
View resource consumption and costs across your organization:
* See spending breakdowns by member, team, or app
* Compare costs against budgets and allocations
* Export usage reports for internal accounting
## Accessing the dashboard
To open the Analytics Dashboard:
1. Go to [replit.com](https://replit.com) and sign in to your Enterprise account.
2. Select **Analytics** from the left navigation on the home page.
Contact your dedicated account manager for help using your Analytics Dashboard.